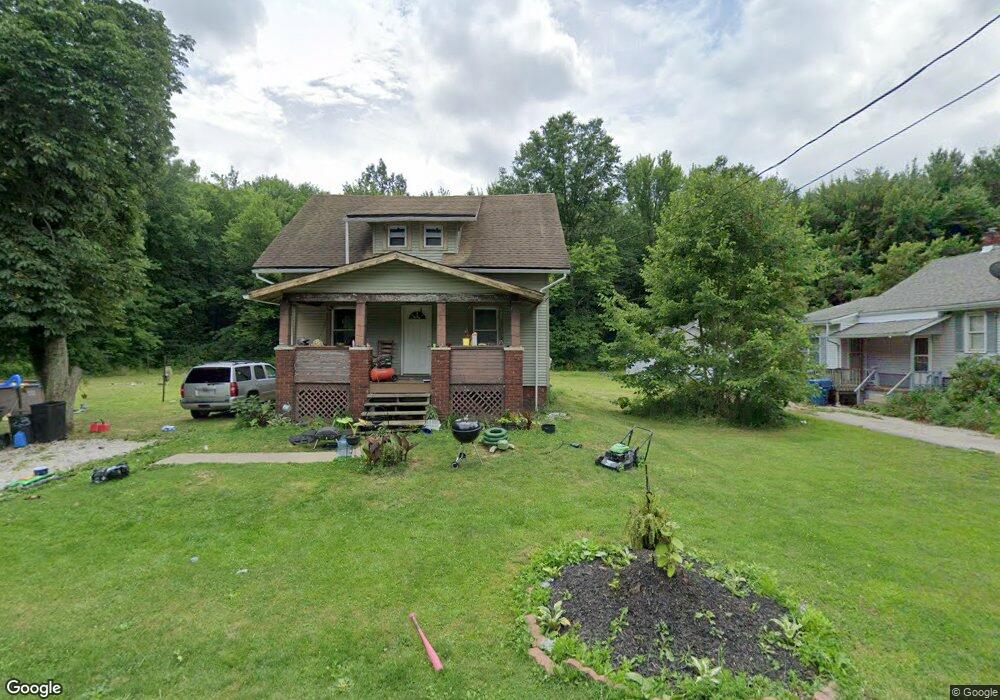
22023 Norman Ave Alliance, OH 44601
Estimated Value: $64,473 - $145,000
2
Beds
1
Bath
972
Sq Ft
$98/Sq Ft
Est. Value
About This Home
This home is located at 22023 Norman Ave, Alliance, OH 44601 and is currently estimated at $94,868, approximately $97 per square foot. 22023 Norman Ave is a home located in Mahoning County with nearby schools including Alliance Intermediate School at Northside, Alliance Elementary School at Rockhill, and Alliance Middle School.
Ownership History
Date
Name
Owned For
Owner Type
Purchase Details
Closed on
Jun 26, 2017
Sold by
Edwards G Vonna
Bought by
Edwards G Vonna and For Our Future Trust
Current Estimated Value
Purchase Details
Closed on
Sep 1, 2010
Sold by
Secretary Of Housing & Urban Development
Bought by
Lynch Ronald R
Purchase Details
Closed on
Apr 27, 2010
Sold by
Bac Home Loans Servicing Lp
Bought by
The Secretary Of Housing & Urban Develop
Purchase Details
Closed on
Mar 18, 2010
Sold by
Schleuder John D and Schleuder Bobby
Bought by
Bac Home Loans Servicing Lp
Purchase Details
Closed on
Dec 20, 2001
Sold by
Cathey Daniel E and Cathey Susan R
Bought by
Schleuder John D and Schleuder Bobby
Home Financials for this Owner
Home Financials are based on the most recent Mortgage that was taken out on this home.
Original Mortgage
$54,562
Interest Rate
6.52%
Mortgage Type
FHA
Purchase Details
Closed on
Sep 3, 1993
Bought by
Cathey Daniel E
Create a Home Valuation Report for This Property
The Home Valuation Report is an in-depth analysis detailing your home's value as well as a comparison with similar homes in the area
Home Values in the Area
Average Home Value in this Area
Purchase History
| Date | Buyer | Sale Price | Title Company |
|---|---|---|---|
| Edwards G Vonna | -- | None Available | |
| Lynch Ronald R | $8,609 | Attorney | |
| The Secretary Of Housing & Urban Develop | -- | None Available | |
| Bac Home Loans Servicing Lp | $14,000 | Attorney | |
| Schleuder John D | $55,000 | -- | |
| Cathey Daniel E | $25,000 | -- |
Source: Public Records
Mortgage History
| Date | Status | Borrower | Loan Amount |
|---|---|---|---|
| Previous Owner | Schleuder John D | $54,562 |
Source: Public Records
Tax History Compared to Growth
Tax History
| Year | Tax Paid | Tax Assessment Tax Assessment Total Assessment is a certain percentage of the fair market value that is determined by local assessors to be the total taxable value of land and additions on the property. | Land | Improvement |
|---|---|---|---|---|
| 2024 | $518 | $12,450 | $1,520 | $10,930 |
| 2023 | $652 | $12,450 | $1,520 | $10,930 |
| 2022 | $156 | $3,430 | $1,160 | $2,270 |
| 2021 | $157 | $3,430 | $1,160 | $2,270 |
| 2020 | $163 | $3,430 | $1,160 | $2,270 |
| 2019 | $153 | $3,070 | $1,160 | $1,910 |
| 2018 | $192 | $3,070 | $1,160 | $1,910 |
| 2017 | $164 | $3,070 | $1,160 | $1,910 |
| 2016 | $317 | $5,980 | $930 | $5,050 |
| 2015 | $312 | $5,980 | $930 | $5,050 |
| 2014 | $325 | $5,980 | $930 | $5,050 |
| 2013 | $320 | $5,980 | $930 | $5,050 |
Source: Public Records
Map
Nearby Homes
- 22841 Lake Park Blvd
- 13600 Caldwell Ave
- 1233 Woodland Ave
- 831 Wade Ave
- 1214 Jersey St
- 814 Milner St
- 1044 S Liberty Ave
- 834 Devine St
- 815 Grace St
- 729 Waugh St
- 442 S Liberty Ave
- 263 Franklin Ave
- 548 E High St
- 1235 Elm St
- 1005 S Freedom Ave
- 452 E Summit St
- V/L S Fredeom Ave
- 328 N Webb Ave
- 432 S Linden Ave
- 404 S Linden Ave
- 22024 Norman Ave
- 22046 Norman Ave
- 22033 Alden Ave
- 22034 Alden Ave
- 14112 Violet Blvd
- 22070 Alden Ave
- 22070 Harding Dr
- 22169 Alden Ave
- 22177 Alden Ave
- 22069 Harding Dr
- 14333 Todd Ave
- 22186 Alden Ave
- 22175 Lake Park Blvd
- 22211 Alden Ave
- 22212 Norman Ave
- 22203 Lake Park Blvd
- 22230 Alden Ave
- 22219 Lake Park Blvd
- 22241 Alden Ave
- 22243 Lake Park Blvd