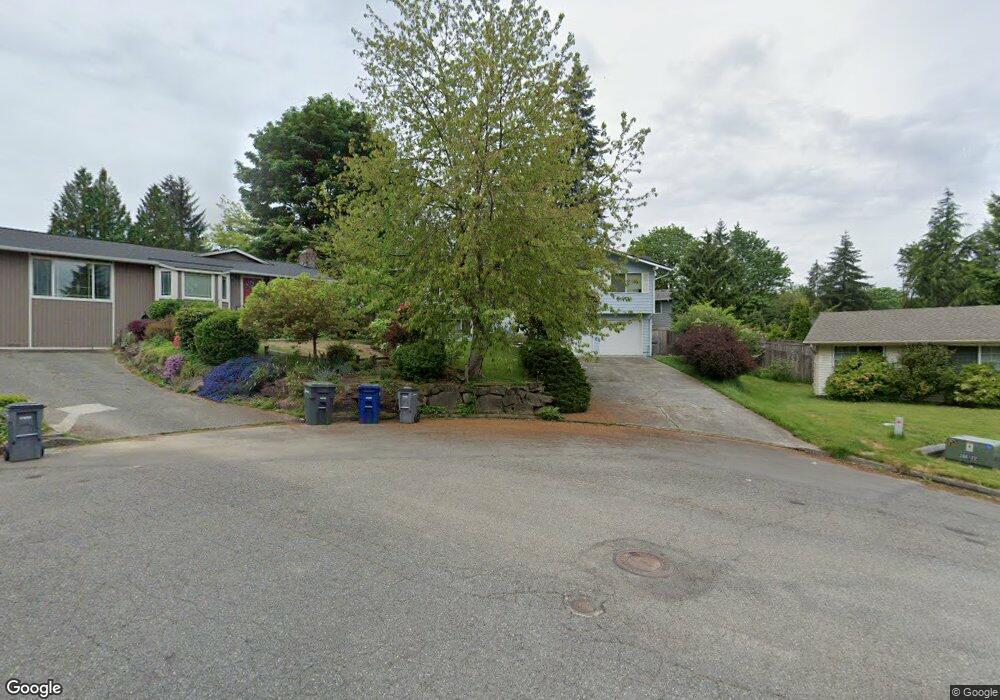
22026 6th Ave W Bothell, WA 98021
Queensborough-Brentwood NeighborhoodEstimated Value: $769,509 - $854,000
3
Beds
3
Baths
1,821
Sq Ft
$456/Sq Ft
Est. Value
About This Home
This home is located at 22026 6th Ave W, Bothell, WA 98021 and is currently estimated at $829,877, approximately $455 per square foot. 22026 6th Ave W is a home located in Snohomish County with nearby schools including Frank Love Elementary School, Kenmore Middle School, and Bothell High School.
Ownership History
Date
Name
Owned For
Owner Type
Purchase Details
Closed on
Sep 25, 2000
Sold by
Hesseltine Stacy E
Bought by
Nayberg Alex J
Current Estimated Value
Home Financials for this Owner
Home Financials are based on the most recent Mortgage that was taken out on this home.
Original Mortgage
$200,461
Outstanding Balance
$66,996
Interest Rate
7.89%
Mortgage Type
FHA
Estimated Equity
$762,881
Purchase Details
Closed on
Jul 22, 1999
Sold by
Costinett Daniel R and Costinett Kelly A
Bought by
Nayberg Alex J and Hesseltine Stacy E
Home Financials for this Owner
Home Financials are based on the most recent Mortgage that was taken out on this home.
Original Mortgage
$192,714
Interest Rate
7.64%
Mortgage Type
FHA
Purchase Details
Closed on
Nov 17, 1994
Sold by
Price Paul G and Price Rosalyn M
Bought by
Costinett Daniel R and Costinett Kelly A
Home Financials for this Owner
Home Financials are based on the most recent Mortgage that was taken out on this home.
Original Mortgage
$143,650
Interest Rate
8.9%
Create a Home Valuation Report for This Property
The Home Valuation Report is an in-depth analysis detailing your home's value as well as a comparison with similar homes in the area
Home Values in the Area
Average Home Value in this Area
Purchase History
| Date | Buyer | Sale Price | Title Company |
|---|---|---|---|
| Nayberg Alex J | $100,857 | -- | |
| Nayberg Alex J | $195,000 | Old Republic Title Ltd | |
| Costinett Daniel R | $151,500 | -- |
Source: Public Records
Mortgage History
| Date | Status | Borrower | Loan Amount |
|---|---|---|---|
| Open | Nayberg Alex J | $200,461 | |
| Previous Owner | Nayberg Alex J | $192,714 | |
| Previous Owner | Costinett Daniel R | $143,650 |
Source: Public Records
Tax History
| Year | Tax Paid | Tax Assessment Tax Assessment Total Assessment is a certain percentage of the fair market value that is determined by local assessors to be the total taxable value of land and additions on the property. | Land | Improvement |
|---|---|---|---|---|
| 2026 | $6,237 | $806,600 | $558,000 | $248,600 |
| 2025 | $5,769 | $734,200 | $495,000 | $239,200 |
| 2024 | $5,769 | $676,100 | $445,000 | $231,100 |
| 2023 | $6,724 | $866,200 | $600,000 | $266,200 |
| 2022 | $6,300 | $655,400 | $430,000 | $225,400 |
| 2020 | $4,832 | $462,900 | $317,000 | $145,900 |
| 2019 | $4,036 | $398,600 | $265,000 | $133,600 |
| 2018 | $3,751 | $356,500 | $235,000 | $121,500 |
| 2017 | $3,075 | $293,700 | $185,000 | $108,700 |
| 2016 | $2,738 | $269,300 | $165,000 | $104,300 |
| 2015 | $2,746 | $256,700 | $155,000 | $101,700 |
| 2013 | $2,559 | $210,600 | $127,000 | $83,600 |
Source: Public Records
Map
Nearby Homes
- 422 216th St SW
- 927 217th St SW
- 625 215th St SW
- 410 214th St SW Unit B
- 22619 4th Ave W Unit 3-103
- 604 213th St SW
- 21707 2nd Ave SE
- 33 213th Place SW
- 21414 2nd Ave SE
- 1313 228th Place SW
- 22213 17th Ave W
- 22827 Meridian Ave S
- 215 Hubbard Rd
- 21120 Meridian Place W
- 21723 3rd Ave SE
- 1232 211th Place SW
- 20912 2nd Ave W
- 20733 Elberta Rd
- 20916 13th Ave W
- 18 232nd Place SW
- 22030 6th Ave W
- 22027 7th Ave W
- 22020 6th Ave W
- 22031 7th Ave W
- 613 221st St SW
- 22033 6th Ave W
- 605 221st St SW
- 619 221st St SW
- 22016 6th Ave W
- 22029 6th Ave W
- 22017 7th Ave W
- 22021 6th Ave W
- 627 221st St SW
- 22030 7th Ave W
- 525 221st St SW
- 22015 6th Ave W
- 622 220th St SW Unit 4
- 633 221st St SW
- 22028 5th Ave W
- 22024 7th Ave W
Your Personal Tour Guide
Ask me questions while you tour the home.