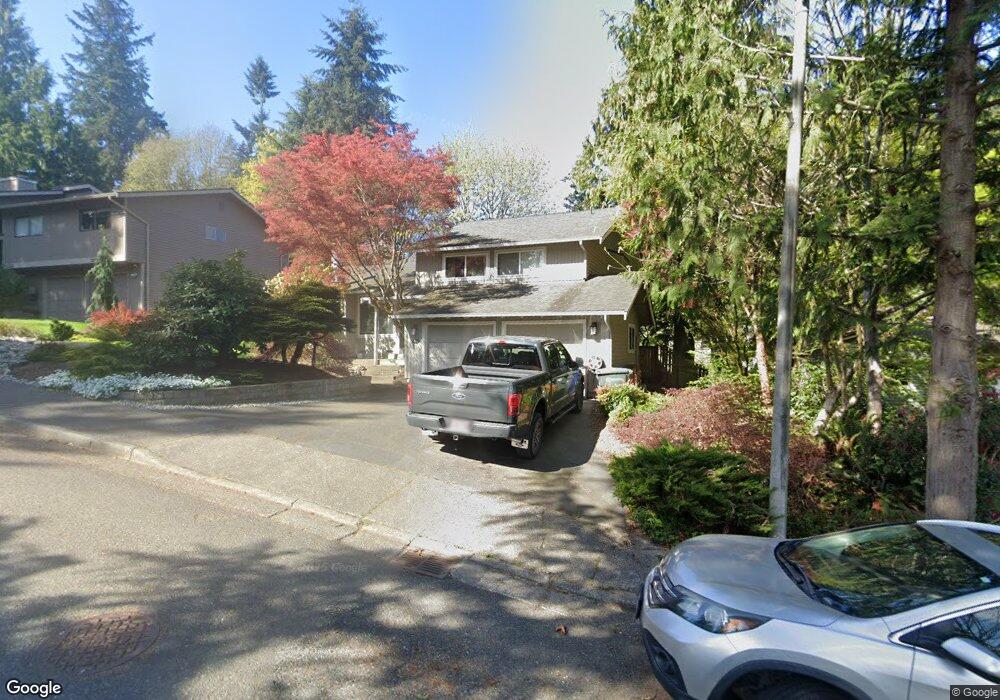
22028 1st Place W Bothell, WA 98021
Queensborough-Brentwood NeighborhoodEstimated Value: $859,593 - $953,000
3
Beds
3
Baths
1,961
Sq Ft
$465/Sq Ft
Est. Value
About This Home
This home is located at 22028 1st Place W, Bothell, WA 98021 and is currently estimated at $910,898, approximately $464 per square foot. 22028 1st Place W is a home located in Snohomish County with nearby schools including Frank Love Elementary School, Kenmore Middle School, and Bothell High School.
Ownership History
Date
Name
Owned For
Owner Type
Purchase Details
Closed on
Apr 8, 2011
Sold by
Orourke Mark R and Orourke Linda A
Bought by
Orourke Linda A and Orourke Mark R
Current Estimated Value
Home Financials for this Owner
Home Financials are based on the most recent Mortgage that was taken out on this home.
Original Mortgage
$223,100
Outstanding Balance
$151,449
Interest Rate
4.46%
Mortgage Type
New Conventional
Estimated Equity
$759,449
Purchase Details
Closed on
May 3, 2000
Sold by
Doohan C Murray and Doohan Harriet
Bought by
Orourke Mark R and Orourke Linda A
Home Financials for this Owner
Home Financials are based on the most recent Mortgage that was taken out on this home.
Original Mortgage
$203,800
Interest Rate
6.25%
Purchase Details
Closed on
Sep 12, 1996
Sold by
Prentice David E and Prentice Linda J
Bought by
Doohan C Murray and Doohan Harriet
Home Financials for this Owner
Home Financials are based on the most recent Mortgage that was taken out on this home.
Original Mortgage
$161,400
Interest Rate
7.88%
Create a Home Valuation Report for This Property
The Home Valuation Report is an in-depth analysis detailing your home's value as well as a comparison with similar homes in the area
Home Values in the Area
Average Home Value in this Area
Purchase History
| Date | Buyer | Sale Price | Title Company |
|---|---|---|---|
| Orourke Linda A | -- | Northwest Title | |
| Orourke Mark R | $226,450 | -- | |
| Doohan C Murray | $169,897 | -- |
Source: Public Records
Mortgage History
| Date | Status | Borrower | Loan Amount |
|---|---|---|---|
| Open | Orourke Linda A | $223,100 | |
| Closed | Orourke Mark R | $203,800 | |
| Previous Owner | Doohan C Murray | $161,400 |
Source: Public Records
Tax History Compared to Growth
Tax History
| Year | Tax Paid | Tax Assessment Tax Assessment Total Assessment is a certain percentage of the fair market value that is determined by local assessors to be the total taxable value of land and additions on the property. | Land | Improvement |
|---|---|---|---|---|
| 2025 | $5,996 | $767,600 | $505,000 | $262,600 |
| 2024 | $5,996 | $703,900 | $450,000 | $253,900 |
| 2023 | $7,291 | $941,900 | $650,000 | $291,900 |
| 2022 | $6,588 | $686,500 | $437,000 | $249,500 |
| 2020 | $5,510 | $530,600 | $313,300 | $217,300 |
| 2019 | $4,826 | $480,500 | $266,800 | $213,700 |
| 2018 | $4,428 | $424,300 | $232,800 | $191,500 |
| 2017 | $3,798 | $367,100 | $190,000 | $177,100 |
| 2016 | $3,482 | $347,300 | $175,000 | $172,300 |
| 2015 | $3,458 | $327,200 | $165,000 | $162,200 |
| 2013 | $3,295 | $274,700 | $138,000 | $136,700 |
Source: Public Records
Map
Nearby Homes
- 210 219th Place SW
- 416 221st St SW
- 22502 3rd Place W
- 525 218th St SW
- 21907 3rd Ave SE
- 22619 4th Ave W Unit 102
- 330 221st St SE
- 22718 1st Place W
- 22423 3rd Ave SE
- 611 216th St SW
- 22710 2nd Ave SE
- 21911 4th Ave SE
- 114 212th St SE
- 604 213th St SW
- 816 218th St SE
- 612 228th St SW Unit K201
- 19924 7th Dr SE
- 20026 7th Dr SE
- 20021 7th Dr SE
- 20932 3rd Ave W
- 22020 1st Place W
- 22100 1st Place W
- 22025 2nd Place W
- 22031 2nd Place W
- 22019 2nd Place W
- 22014 1st Place W
- 129 221st St SW
- 22108 1st Place W
- 22027 1st Place W
- 203 221st St SW
- 22023 1st Place W
- 22103 1st Place W
- 22105 2nd Place W
- 22010 1st Place W
- 22013 2nd Place W
- 22017 1st Place W
- 22111 1st Place W
- 22011 1st Place W
- 22030 2nd Place W
- 22022 2nd Place W