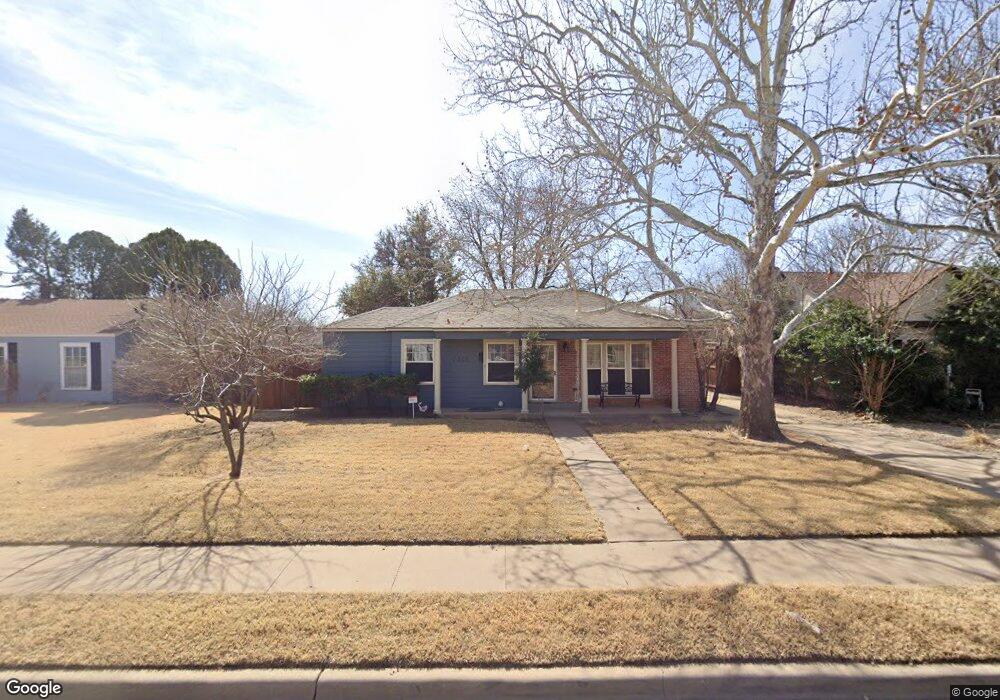
2203 29th St Lubbock, TX 79411
Heart of Lubbock NeighborhoodEstimated Value: $145,791 - $157,000
3
Beds
1
Bath
1,584
Sq Ft
$96/Sq Ft
Est. Value
About This Home
This home is located at 2203 29th St, Lubbock, TX 79411 and is currently estimated at $151,698, approximately $95 per square foot. 2203 29th St is a home located in Lubbock County with nearby schools including Dupre Elementary School, Brown Elementary School, and Slaton Middle School.
Ownership History
Date
Name
Owned For
Owner Type
Purchase Details
Closed on
Aug 11, 2006
Sold by
Dornier Lelaine A
Bought by
Houk Brett Alan
Current Estimated Value
Home Financials for this Owner
Home Financials are based on the most recent Mortgage that was taken out on this home.
Original Mortgage
$32,000
Interest Rate
6.75%
Mortgage Type
Purchase Money Mortgage
Purchase Details
Closed on
Nov 18, 1999
Sold by
Ashby Lyman O
Bought by
Houk Brett Alan
Create a Home Valuation Report for This Property
The Home Valuation Report is an in-depth analysis detailing your home's value as well as a comparison with similar homes in the area
Home Values in the Area
Average Home Value in this Area
Purchase History
| Date | Buyer | Sale Price | Title Company |
|---|---|---|---|
| Houk Brett Alan | $82,000 | None Available | |
| Houk Brett Alan | -- | -- |
Source: Public Records
Mortgage History
| Date | Status | Borrower | Loan Amount |
|---|---|---|---|
| Closed | Houk Brett Alan | $32,000 |
Source: Public Records
Tax History Compared to Growth
Tax History
| Year | Tax Paid | Tax Assessment Tax Assessment Total Assessment is a certain percentage of the fair market value that is determined by local assessors to be the total taxable value of land and additions on the property. | Land | Improvement |
|---|---|---|---|---|
| 2025 | $1,409 | $131,915 | $32,000 | $99,915 |
| 2024 | $1,409 | $128,391 | $10,500 | $117,891 |
| 2023 | $1,232 | $115,994 | $10,500 | $119,286 |
| 2022 | $2,135 | $105,449 | $10,500 | $96,266 |
| 2021 | $2,053 | $95,863 | $10,500 | $88,989 |
| 2020 | $1,895 | $87,148 | $10,500 | $76,648 |
| 2019 | $1,866 | $83,112 | $10,500 | $72,612 |
| 2018 | $1,698 | $75,556 | $10,500 | $65,056 |
| 2017 | $1,743 | $77,450 | $3,300 | $74,150 |
| 2016 | $1,743 | $77,450 | $3,300 | $74,150 |
| 2015 | $1,392 | $76,422 | $3,300 | $73,122 |
| 2014 | $1,392 | $70,924 | $3,300 | $67,624 |
Source: Public Records
Map
Nearby Homes