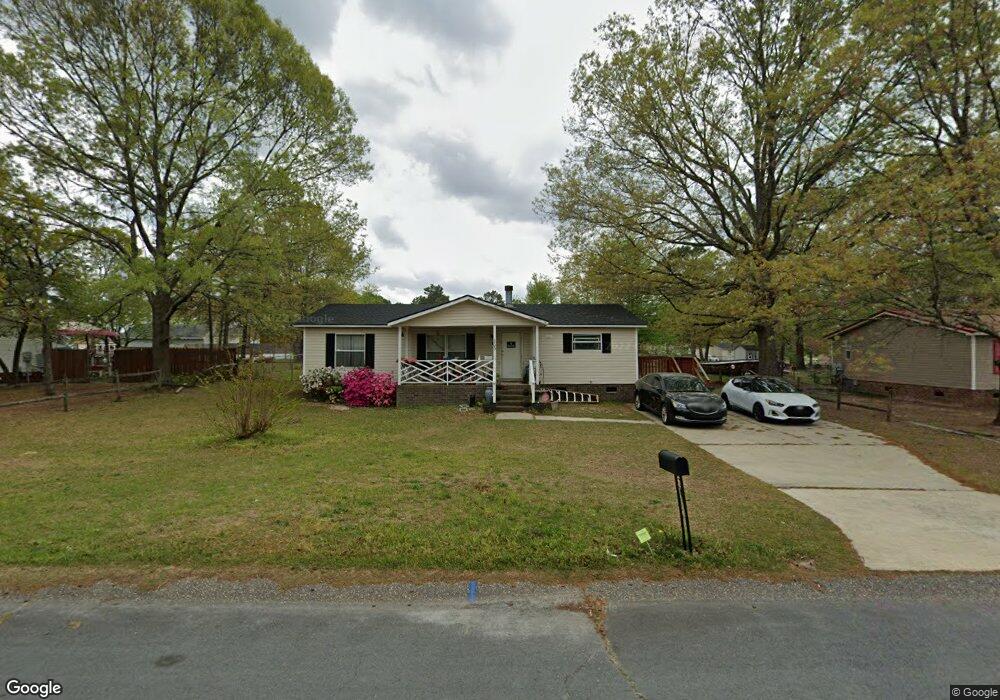
2203 Keen Ct Raeford, NC 28376
Estimated Value: $40,409 - $157,000
3
Beds
2
Baths
1,296
Sq Ft
$75/Sq Ft
Est. Value
About This Home
This home is located at 2203 Keen Ct, Raeford, NC 28376 and is currently estimated at $96,602, approximately $74 per square foot. 2203 Keen Ct is a home located in Hoke County with nearby schools including Upchurch Elementary School, East Hoke Middle, and Hoke County High.
Ownership History
Date
Name
Owned For
Owner Type
Purchase Details
Closed on
Jan 19, 2024
Sold by
Pierce Charlene
Bought by
Pierce Charlene
Current Estimated Value
Home Financials for this Owner
Home Financials are based on the most recent Mortgage that was taken out on this home.
Original Mortgage
$63,350
Outstanding Balance
$55,544
Interest Rate
6.95%
Mortgage Type
VA
Estimated Equity
$41,058
Create a Home Valuation Report for This Property
The Home Valuation Report is an in-depth analysis detailing your home's value as well as a comparison with similar homes in the area
Home Values in the Area
Average Home Value in this Area
Purchase History
| Date | Buyer | Sale Price | Title Company |
|---|---|---|---|
| Pierce Charlene | $37,500 | None Listed On Document | |
| Pierce Charlene | $37,500 | None Listed On Document |
Source: Public Records
Mortgage History
| Date | Status | Borrower | Loan Amount |
|---|---|---|---|
| Open | Pierce Charlene | $63,350 | |
| Closed | Pierce Charlene | $63,350 |
Source: Public Records
Tax History Compared to Growth
Tax History
| Year | Tax Paid | Tax Assessment Tax Assessment Total Assessment is a certain percentage of the fair market value that is determined by local assessors to be the total taxable value of land and additions on the property. | Land | Improvement |
|---|---|---|---|---|
| 2025 | $596 | $57,560 | $20,000 | $37,560 |
| 2024 | $596 | $57,560 | $20,000 | $37,560 |
| 2023 | $596 | $57,560 | $20,000 | $37,560 |
| 2022 | $587 | $57,560 | $20,000 | $37,560 |
| 2021 | $525 | $48,540 | $10,000 | $38,540 |
| 2020 | $531 | $48,540 | $10,000 | $38,540 |
| 2019 | $531 | $48,540 | $10,000 | $38,540 |
| 2018 | $531 | $48,540 | $10,000 | $38,540 |
| 2017 | $531 | $48,540 | $10,000 | $38,540 |
| 2016 | $523 | $48,540 | $10,000 | $38,540 |
| 2015 | $523 | $48,540 | $10,000 | $38,540 |
| 2014 | $503 | $48,540 | $10,000 | $38,540 |
| 2013 | -- | $64,570 | $19,000 | $45,570 |
Source: Public Records
Map
Nearby Homes