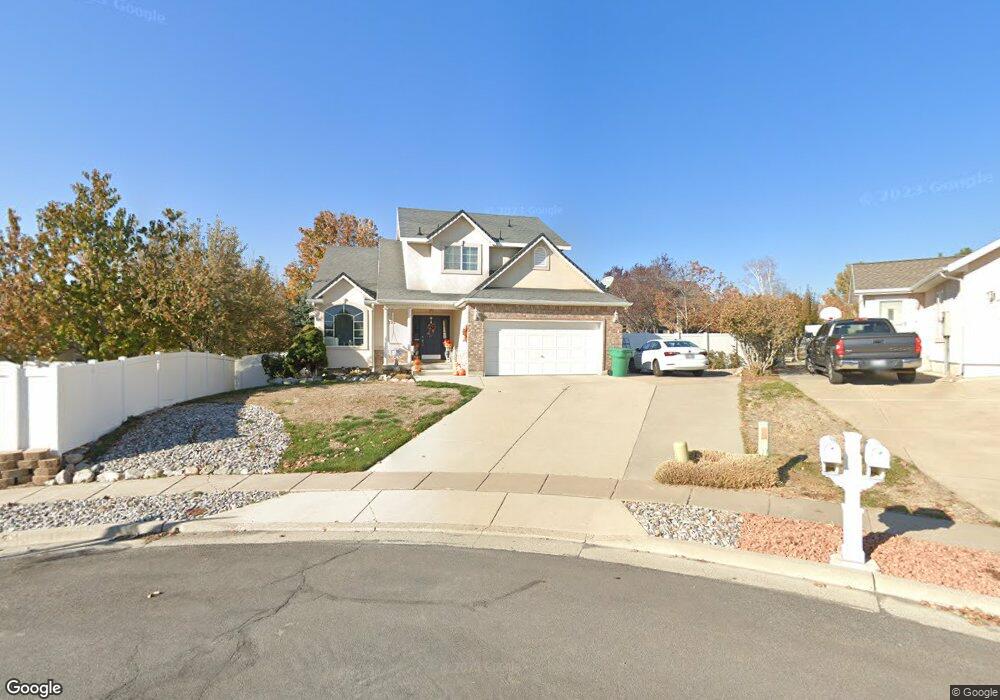
2203 N 675 W Layton, UT 84041
Estimated Value: $464,000 - $554,000
3
Beds
3
Baths
1,744
Sq Ft
$298/Sq Ft
Est. Value
About This Home
This home is located at 2203 N 675 W, Layton, UT 84041 and is currently estimated at $519,237, approximately $297 per square foot. 2203 N 675 W is a home located in Davis County with nearby schools including Lincoln Elementary School, North Layton Junior High School, and Northridge High School.
Ownership History
Date
Name
Owned For
Owner Type
Purchase Details
Closed on
Jun 6, 2001
Sold by
Delamater Brian J and Delamater Mary Irene
Bought by
Radnoff Rudolph C and Radnoff Jenifer E
Current Estimated Value
Home Financials for this Owner
Home Financials are based on the most recent Mortgage that was taken out on this home.
Original Mortgage
$86,000
Outstanding Balance
$32,374
Interest Rate
7.14%
Estimated Equity
$486,863
Purchase Details
Closed on
Mar 30, 1999
Sold by
Symmetry Development Inc
Bought by
Delamater Brian J and Delamater Mary Irene
Home Financials for this Owner
Home Financials are based on the most recent Mortgage that was taken out on this home.
Original Mortgage
$185,640
Interest Rate
6.79%
Mortgage Type
VA
Purchase Details
Closed on
Feb 2, 1998
Sold by
Sli Commercial Real Estate Co
Bought by
Symmetry Development Inc and Symmetry Homes
Home Financials for this Owner
Home Financials are based on the most recent Mortgage that was taken out on this home.
Original Mortgage
$142,400
Interest Rate
6.98%
Mortgage Type
Construction
Create a Home Valuation Report for This Property
The Home Valuation Report is an in-depth analysis detailing your home's value as well as a comparison with similar homes in the area
Home Values in the Area
Average Home Value in this Area
Purchase History
| Date | Buyer | Sale Price | Title Company |
|---|---|---|---|
| Radnoff Rudolph C | -- | Backman Stewart Title Servic | |
| Delamater Brian J | -- | Bonneville Title Company Inc | |
| Symmetry Development Inc | -- | Bonneville Title Company Inc |
Source: Public Records
Mortgage History
| Date | Status | Borrower | Loan Amount |
|---|---|---|---|
| Open | Radnoff Rudolph C | $86,000 | |
| Previous Owner | Delamater Brian J | $185,640 | |
| Previous Owner | Symmetry Development Inc | $142,400 |
Source: Public Records
Tax History Compared to Growth
Tax History
| Year | Tax Paid | Tax Assessment Tax Assessment Total Assessment is a certain percentage of the fair market value that is determined by local assessors to be the total taxable value of land and additions on the property. | Land | Improvement |
|---|---|---|---|---|
| 2025 | $2,515 | $264,000 | $107,571 | $156,429 |
| 2024 | $2,398 | $253,549 | $125,314 | $128,235 |
| 2023 | $2,484 | $254,650 | $81,799 | $172,850 |
| 2022 | $2,554 | $470,000 | $143,109 | $326,891 |
| 2021 | $2,325 | $351,000 | $110,609 | $240,391 |
| 2020 | $2,113 | $306,000 | $92,985 | $213,015 |
| 2019 | $2,045 | $290,000 | $88,237 | $201,763 |
| 2018 | $2,009 | $286,000 | $88,237 | $197,763 |
| 2016 | $1,744 | $128,095 | $28,245 | $99,850 |
| 2015 | $1,782 | $124,300 | $28,245 | $96,055 |
| 2014 | $1,821 | $129,840 | $28,245 | $101,595 |
| 2013 | -- | $118,084 | $26,884 | $91,200 |
Source: Public Records
Map
Nearby Homes
- 2149 N 750 W
- 2211 N 525 W
- 506 W 2200 N
- 2248 N 500 W
- 2233 N 475 W
- 2298 N 1085 W
- 538 W 1875 N
- 1155 W 2200 N
- 398 Paul Ave
- 2053 Evans Cove Loop Unit 39
- 1715 N Alder St
- 95 W 2400 N
- 2600 N Hill Field Rd Unit 108
- 2600 N Hill Field Rd Unit 4
- 2048 Evans Cove Loop
- 2875 N Hill Field Rd Unit 17
- 2875 N Hill Field Rd Unit 199
- 2875 N Hill Field Rd Unit 58
- 2875 N Hill Field Rd Unit 62
- 2875 N Hill Field Rd Unit 40