D
Seller's Agent in 2015
DEBBIE G FOREMAN
Coldwell Banker Walden & Kirkland
(229) 869-4130
3 in this area
59 Total Sales
Estimated Value: $294,000 - $347,000
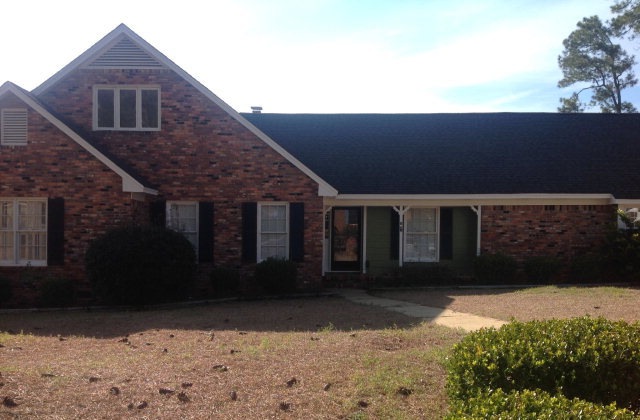
REDUCED! Great find in Lake Park. Just in time for summer. Beautiful pool and pool house. Look at the square footage in this house. 4 or 5 bedrooms, 3 full baths, lovely hardwood floors. 2 fireplaces, enclosed porch looks out over sparkling pool. Kitchen with large island opens to den with fireplace...could be great keeping room. Huge Great room off kitchen with built ins and fireplace. Great area for a large family. Nice size bedrooms with lots of closets and a huge bonus room upstairs. This would make a great play room, home school space or man cave....so many possibilities! So much space! Walking distance to Lake Park School.
Last Agent to Sell the Property
Coldwell Banker Walden & Kirkland Brokerage Phone: 2294368811 License #280173 Listed on: 06/27/2015
| Date | Buyer | Sale Price | Title Company |
|---|---|---|---|
| Hemmings Brandon Scott | $130,000 | -- | |
| Nwadei Fabian | $177,400 | -- | |
| Nwadei Fabain | $145,000 | -- | |
| Smith Scott M | $126,000 | -- | |
| Trust Co Bk Of So Ga | $153,000 | -- | |
| Walden Wm H | $159,300 | -- | |
| Hillis Connie Myers | -- | -- |
| Date | Status | Borrower | Loan Amount |
|---|---|---|---|
| Open | Hemmings Brandon Scott | $123,500 |
| Date | Event | Price | List to Sale | Price per Sq Ft |
|---|---|---|---|---|
| 08/03/2015 08/03/15 | Sold | $130,000 | -- | $35 / Sq Ft |
| 06/27/2015 06/27/15 | Pending | -- | -- | -- |
| Year | Tax Paid | Tax Assessment Tax Assessment Total Assessment is a certain percentage of the fair market value that is determined by local assessors to be the total taxable value of land and additions on the property. | Land | Improvement |
|---|---|---|---|---|
| 2024 | $4,057 | $87,028 | $10,720 | $76,308 |
| 2023 | $3,123 | $87,028 | $10,720 | $76,308 |
| 2022 | $3,976 | $87,028 | $10,720 | $76,308 |
| 2021 | $3,686 | $87,028 | $10,720 | $76,308 |
| 2020 | $3,695 | $87,028 | $10,720 | $76,308 |
| 2019 | $3,709 | $87,028 | $10,720 | $76,308 |
| 2018 | $3,725 | $87,028 | $10,720 | $76,308 |
| 2017 | $3,470 | $87,028 | $10,720 | $76,308 |
| 2016 | $2,042 | $87,028 | $10,720 | $76,308 |
| 2015 | $3,481 | $87,028 | $10,720 | $76,308 |
| 2014 | $3,438 | $87,028 | $10,720 | $76,308 |
D
Seller's Agent in 2015
DEBBIE G FOREMAN
Coldwell Banker Walden & Kirkland
(229) 869-4130
3 in this area
59 Total Sales

Buyer's Agent in 2015
Mary Linda Cotten
Coldwell Banker Walden & Kirkland
(229) 347-0953
11 in this area
214 Total Sales
Source: Albany Board of REALTORS®
MLS Number: 133239
APN: 00303-00006-013