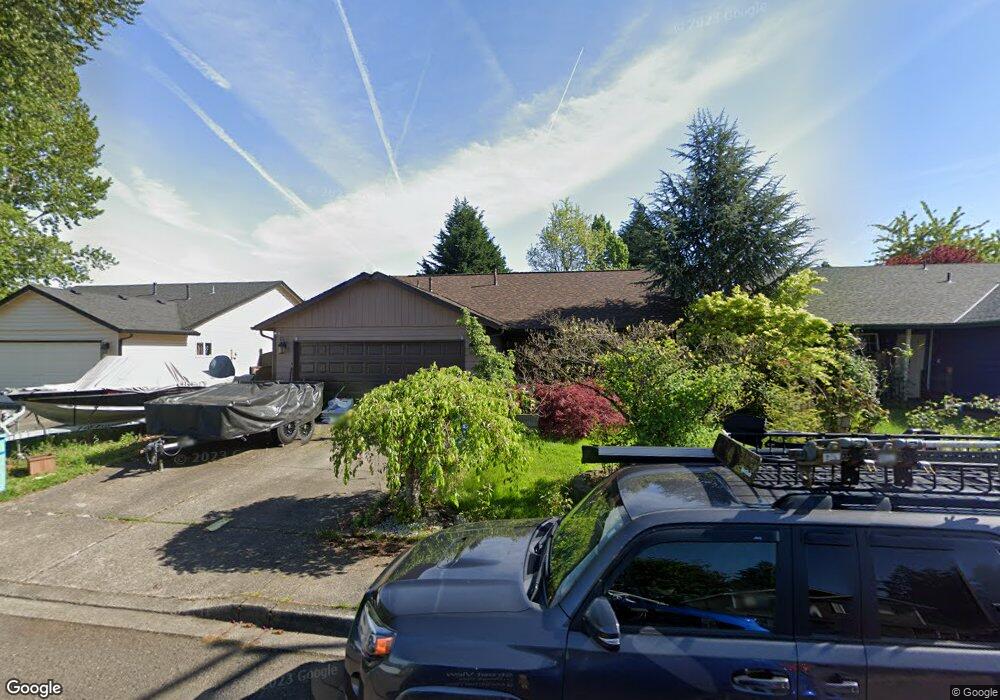
2203 SW 6th St Battle Ground, WA 98604
Estimated Value: $434,329 - $444,000
3
Beds
2
Baths
1,188
Sq Ft
$369/Sq Ft
Est. Value
About This Home
This home is located at 2203 SW 6th St, Battle Ground, WA 98604 and is currently estimated at $437,832, approximately $368 per square foot. 2203 SW 6th St is a home located in Clark County with nearby schools including Maple Grove Primary School, Prairie High School, and Firm Foundation Christian School.
Ownership History
Date
Name
Owned For
Owner Type
Purchase Details
Closed on
Sep 1, 2022
Sold by
Vyfvinkel and Evelynne
Bought by
Amended And Restated The Vyfvinkel Family Tru
Current Estimated Value
Purchase Details
Closed on
Jun 21, 2022
Sold by
Vyfvinkel Foundation Trust
Bought by
Vyfvinkel Bernhard and Vyfvinkel Bernhard
Purchase Details
Closed on
Feb 2, 2021
Sold by
Vyvinkel Banhard and Vyvinkel Evelynne
Bought by
Vyvinkel Bernard and Vyvinkel Evelynne
Purchase Details
Closed on
Aug 24, 2000
Sold by
Robinson Richard L and Robinson Diane
Bought by
Vyfvinkel Bernhard and Vyfvinkel Evelynne
Purchase Details
Closed on
Jan 19, 1996
Sold by
Tig Construction Llc
Bought by
Robinson Richard L and Robinson Diane
Home Financials for this Owner
Home Financials are based on the most recent Mortgage that was taken out on this home.
Original Mortgage
$92,000
Interest Rate
7.18%
Create a Home Valuation Report for This Property
The Home Valuation Report is an in-depth analysis detailing your home's value as well as a comparison with similar homes in the area
Home Values in the Area
Average Home Value in this Area
Purchase History
| Date | Buyer | Sale Price | Title Company |
|---|---|---|---|
| Amended And Restated The Vyfvinkel Family Tru | -- | None Listed On Document | |
| Vyfvinkel Bernhard | -- | None Listed On Document | |
| Vyvinkel Bernard | -- | None Available | |
| Vyfvinkel Bernhard | -- | Chicago Title Insurance Co | |
| Robinson Richard L | $101,698 | Charter Title Corp |
Source: Public Records
Mortgage History
| Date | Status | Borrower | Loan Amount |
|---|---|---|---|
| Previous Owner | Robinson Richard L | $92,000 |
Source: Public Records
Tax History Compared to Growth
Tax History
| Year | Tax Paid | Tax Assessment Tax Assessment Total Assessment is a certain percentage of the fair market value that is determined by local assessors to be the total taxable value of land and additions on the property. | Land | Improvement |
|---|---|---|---|---|
| 2025 | $3,091 | $367,976 | $155,000 | $212,976 |
| 2024 | $2,688 | $379,749 | $155,000 | $224,749 |
| 2023 | $2,855 | $375,750 | $155,000 | $220,750 |
| 2022 | $2,846 | $363,984 | $131,750 | $232,234 |
| 2021 | $2,709 | $315,308 | $116,875 | $198,433 |
| 2020 | $2,317 | $275,279 | $97,750 | $177,529 |
| 2019 | $1,912 | $266,930 | $100,300 | $166,630 |
| 2018 | $2,216 | $257,884 | $0 | $0 |
| 2017 | $1,866 | $219,390 | $0 | $0 |
| 2016 | $1,864 | $201,309 | $0 | $0 |
| 2015 | $1,822 | $184,477 | $0 | $0 |
| 2014 | -- | $171,094 | $0 | $0 |
| 2013 | -- | $156,256 | $0 | $0 |
Source: Public Records
Map
Nearby Homes
- 2301 SW 5th Cir
- 2111 SW 5th St
- 2307 SW 5th Cir
- 2507 SW 5th Way
- 1816 SW 6th St
- 2514 W Main St
- 1019 SW 27th Ct
- 1513 SW 6th St
- 1512 SW 5th St
- 502 SW 15th Ave
- 0 W Main St Unit 793373106
- 0 W Main St Unit 261126278
- 1807 NW 3rd St
- 0 NW 2nd St Unit 2 & 3 780233409
- 0 NW 2nd St Unit 3 282019710
- 0 NW 2nd St Unit 2 167106682
- 20204 NE 104th Ave
- 1608 NW 3rd St
- 344 NW 29th Way
- 1600 NW 3rd St