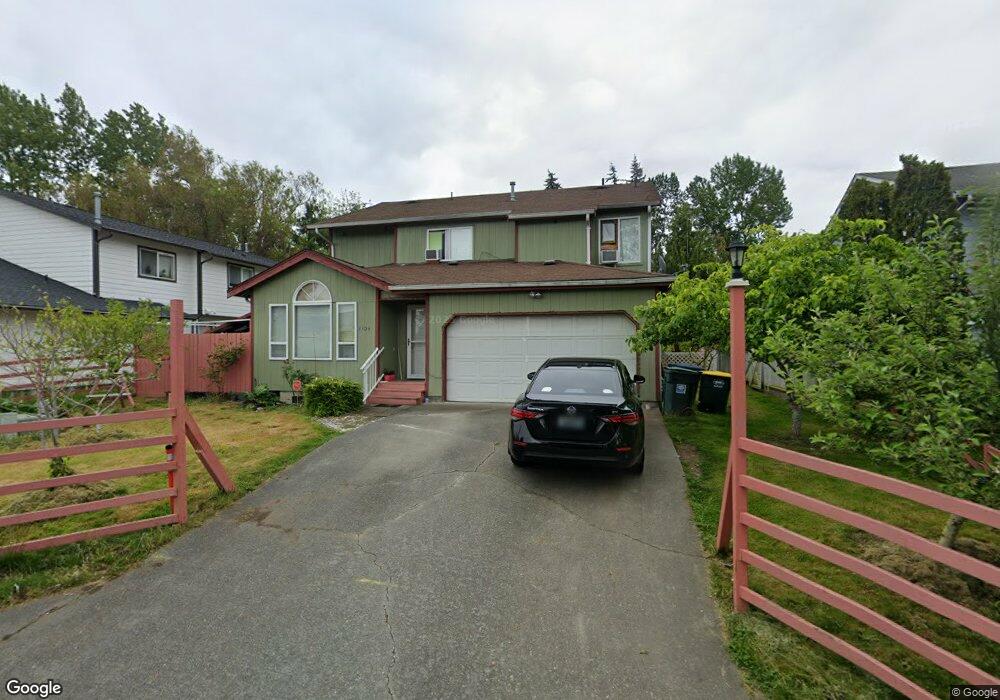
2203 Xenia Ln Bellingham, WA 98229
Roosevelt NeighborhoodEstimated Value: $635,000 - $799,000
2
Beds
2
Baths
2,128
Sq Ft
$340/Sq Ft
Est. Value
About This Home
This home is located at 2203 Xenia Ln, Bellingham, WA 98229 and is currently estimated at $724,394, approximately $340 per square foot. 2203 Xenia Ln is a home located in Whatcom County with nearby schools including Roosevelt Elementary School, Kulshan Middle School, and Bellingham High School.
Ownership History
Date
Name
Owned For
Owner Type
Purchase Details
Closed on
Jan 6, 2022
Sold by
Ona Jose D and Ona Annie M
Bought by
Jose And Annie Ona Trust
Current Estimated Value
Purchase Details
Closed on
Dec 2, 2010
Sold by
Bank Of America National Association
Bought by
Ona Jose D and Ona Annie M
Purchase Details
Closed on
Jul 21, 2010
Sold by
Turns To The East
Bought by
Bank Of America National Association
Purchase Details
Closed on
Apr 6, 2006
Sold by
Macinnes Wayne
Bought by
Turns To The East
Home Financials for this Owner
Home Financials are based on the most recent Mortgage that was taken out on this home.
Original Mortgage
$51,750
Interest Rate
5.88%
Mortgage Type
Credit Line Revolving
Create a Home Valuation Report for This Property
The Home Valuation Report is an in-depth analysis detailing your home's value as well as a comparison with similar homes in the area
Home Values in the Area
Average Home Value in this Area
Purchase History
| Date | Buyer | Sale Price | Title Company |
|---|---|---|---|
| Jose And Annie Ona Trust | $313 | None Listed On Document | |
| Ona Jose D | $224,280 | First American Title Ins | |
| Bank Of America National Association | $305,724 | First American Title Ins | |
| Turns To The East | $345,280 | Chicago Title Insurance |
Source: Public Records
Mortgage History
| Date | Status | Borrower | Loan Amount |
|---|---|---|---|
| Previous Owner | Turns To The East | $51,750 | |
| Previous Owner | Turns To The East | $276,000 |
Source: Public Records
Tax History Compared to Growth
Tax History
| Year | Tax Paid | Tax Assessment Tax Assessment Total Assessment is a certain percentage of the fair market value that is determined by local assessors to be the total taxable value of land and additions on the property. | Land | Improvement |
|---|---|---|---|---|
| 2024 | $5,607 | $702,651 | $238,607 | $464,044 |
| 2023 | $5,607 | $720,499 | $244,668 | $475,831 |
| 2022 | $4,579 | $621,130 | $210,924 | $410,206 |
| 2021 | $4,492 | $492,961 | $167,400 | $325,561 |
| 2020 | $3,938 | $456,445 | $155,000 | $301,445 |
| 2019 | $3,525 | $386,734 | $124,778 | $261,956 |
| 2018 | $3,550 | $347,141 | $112,028 | $235,113 |
| 2017 | $3,064 | $298,878 | $96,450 | $202,428 |
| 2016 | $2,680 | $269,556 | $86,550 | $183,006 |
| 2015 | $2,628 | $245,477 | $79,050 | $166,427 |
| 2014 | -- | $232,900 | $75,000 | $157,900 |
| 2013 | -- | $212,149 | $73,500 | $138,649 |
Source: Public Records
Map
Nearby Homes
- 2138 Woburn St
- 2316 Xenia St
- 2409 Xenia St
- 2325 Valencia St
- 950 Yew St
- 2330 Verona St
- 2602 Woburn St
- 2735 Michigan St
- 1735 Sunup Loop
- 1737 Sunup Loop
- 1733 Sunup Loop
- 2312 Orleans St
- 2209 W Birch St
- 2104 Birch Cir Unit 5C
- 1712 Sunup Loop
- 1714 Sunup Loop
- 1716 Sunup Loop
- 2612 Birch St
- 3700 Alabama St Unit 316
- 0 US Highway 27 Hwy N Unit MFRP4936152
- 2203 W Xenia Ln
- 2203 Xenia Ln
- 2209 Xenia Ln
- 2139 Xenia Ln
- 2133 W Xenia Ln
- 2133 Xenia Ln
- 2215 Xenia Ln
- 2103 Xenia Ln
- 2204 Xenia St
- 2142 Woburn St
- 2144 Woburn St
- 2134 Woburn St
- 2206 Woburn St
- 2202 Xenia St
- 2127 Xenia Ln
- 2221 Xenia Ln
- 2138 Xenia St
- 2221 W Xenia Ln
- 2208 Xenia St Unit 2206
- 2206 Xenia St Unit 2206