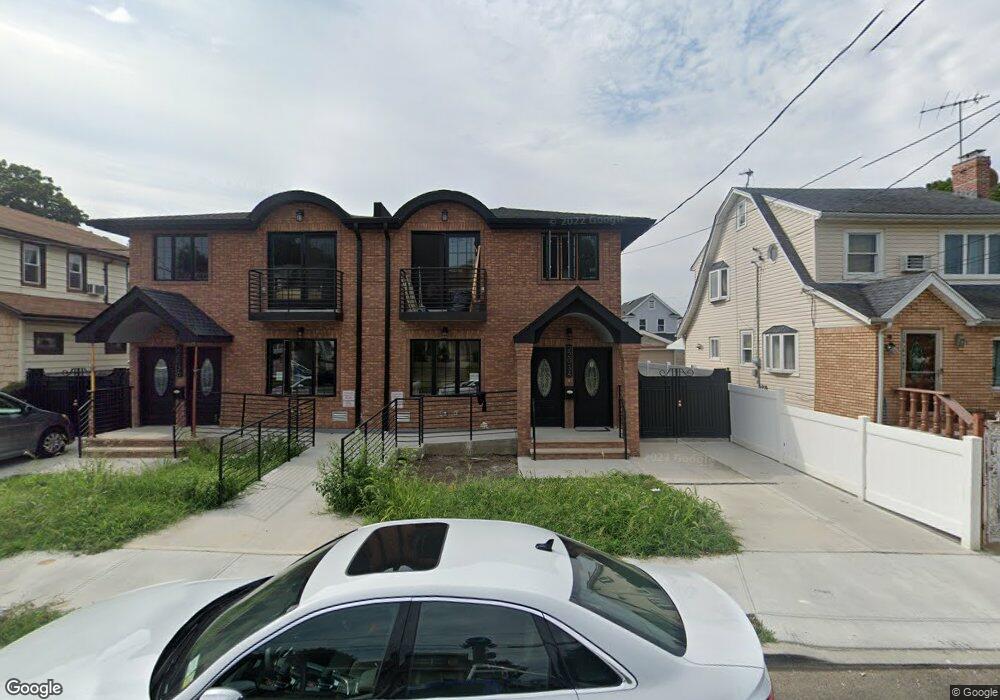
22034 93rd Rd Queens Village, NY 11428
Queens Village NeighborhoodEstimated Value: $1,030,000 - $1,300,000
--
Bed
--
Bath
2,038
Sq Ft
$548/Sq Ft
Est. Value
About This Home
This home is located at 22034 93rd Rd, Queens Village, NY 11428 and is currently estimated at $1,116,880, approximately $548 per square foot. 22034 93rd Rd is a home located in Queens County with nearby schools including P.S. 33 Edward M. Funk, Jean Nuzzi Intermediate School, and Ss Joachim & Anne School.
Ownership History
Date
Name
Owned For
Owner Type
Purchase Details
Closed on
Feb 13, 2019
Sold by
Soto Ralph
Bought by
Singh Rajinder
Current Estimated Value
Purchase Details
Closed on
Nov 30, 2000
Sold by
Moran Roberto and Moran Matilde
Bought by
Bermeo Manuel Avila
Home Financials for this Owner
Home Financials are based on the most recent Mortgage that was taken out on this home.
Original Mortgage
$171,500
Interest Rate
11.5%
Mortgage Type
Purchase Money Mortgage
Purchase Details
Closed on
Jul 31, 1997
Sold by
Doodnauth Sabita
Bought by
Soto Ralph
Home Financials for this Owner
Home Financials are based on the most recent Mortgage that was taken out on this home.
Original Mortgage
$153,350
Interest Rate
7.38%
Mortgage Type
FHA
Purchase Details
Closed on
Mar 5, 1997
Sold by
Federal Home Loan Mortgage Corporation
Bought by
Doodnauth Sabita
Create a Home Valuation Report for This Property
The Home Valuation Report is an in-depth analysis detailing your home's value as well as a comparison with similar homes in the area
Home Values in the Area
Average Home Value in this Area
Purchase History
| Date | Buyer | Sale Price | Title Company |
|---|---|---|---|
| Singh Rajinder | $530,000 | -- | |
| Singh Rajinder | $530,000 | -- | |
| Bermeo Manuel Avila | $235,000 | -- | |
| Bermeo Manuel Avila | $235,000 | -- | |
| Soto Ralph | $187,500 | First American Title Ins Co | |
| Soto Ralph | $187,500 | First American Title Ins Co | |
| Doodnauth Sabita | $116,000 | -- | |
| Doodnauth Sabita | $116,000 | -- |
Source: Public Records
Mortgage History
| Date | Status | Borrower | Loan Amount |
|---|---|---|---|
| Previous Owner | Bermeo Manuel Avila | $171,500 | |
| Previous Owner | Soto Ralph | $153,350 |
Source: Public Records
Tax History Compared to Growth
Tax History
| Year | Tax Paid | Tax Assessment Tax Assessment Total Assessment is a certain percentage of the fair market value that is determined by local assessors to be the total taxable value of land and additions on the property. | Land | Improvement |
|---|---|---|---|---|
| 2025 | $10,763 | $56,040 | $22,580 | $33,460 |
| 2024 | $10,763 | $53,587 | $20,216 | $33,371 |
| 2023 | $7,391 | $36,799 | $18,375 | $18,424 |
| 2022 | $6,930 | $43,860 | $22,500 | $21,360 |
| 2021 | $5,303 | $25,200 | $25,200 | $0 |
| 2020 | $6,218 | $33,300 | $15,600 | $17,700 |
| 2019 | $5,855 | $36,660 | $15,600 | $21,060 |
| 2018 | $5,383 | $26,406 | $12,195 | $14,211 |
| 2017 | $5,078 | $24,912 | $12,626 | $12,286 |
| 2016 | $4,894 | $24,912 | $12,626 | $12,286 |
| 2015 | $2,615 | $24,480 | $11,349 | $13,131 |
| 2014 | $2,615 | $23,325 | $12,976 | $10,349 |
Source: Public Records
Map
Nearby Homes
- 22114 Fairbury Ave
- 94-40 221st St
- 222-26 93rd Ave
- 93-50 224th St
- 22233 93rd Ave
- 93-44 224th St
- 93-44/50 & 93rd rd 224th St
- 22417 Fairbury Ave
- 9456 225th St
- 224-11 Edmore Ave
- 22235 Davenport Ave
- 224-30 Edmore Ave
- 237-20 93rd Ave
- 9434 238th St
- 94-86 218th St
- 93-22 217th St
- 91-39 Springfield Blvd
- 92-05 218th Place
- 9129 220th St
- 97-16 222nd St
- 220-34 93rd Rd Unit 2nd FL
- 22034 93rd Rd
- 220-34 93rd Rd
- 22038 93rd Rd
- 220-38 93rd Rd
- 22030 93rd Rd
- 22036 93rd Rd
- 22044 93rd Rd
- 22024 93rd Rd
- 22033 94th Ave
- 22035 94th Ave
- 22029 94th Ave
- 22101 94th Ave
- 22025 94th Ave
- 22046 93rd Rd
- 22020 93rd Rd
- 22105 94th Ave
- 22023 94th Ave
- 22035 93rd Rd
- 22021 94th Ave