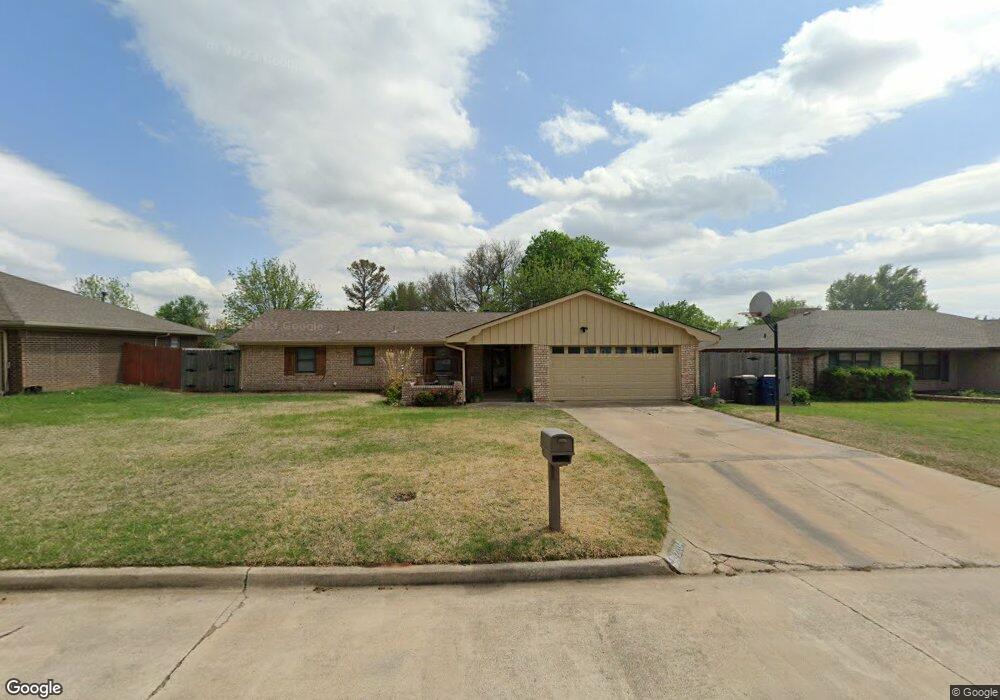
2204 Flamingo Ln Duncan, OK 73533
Estimated Value: $204,000 - $229,000
4
Beds
2
Baths
1,885
Sq Ft
$114/Sq Ft
Est. Value
About This Home
This home is located at 2204 Flamingo Ln, Duncan, OK 73533 and is currently estimated at $215,167, approximately $114 per square foot. 2204 Flamingo Ln is a home located in Stephens County with nearby schools including Horace Mann Elementary School, Duncan Middle School, and Duncan High School.
Ownership History
Date
Name
Owned For
Owner Type
Purchase Details
Closed on
Jan 6, 2023
Sold by
Bridges Darren L and Bridges Jana C
Bought by
Pollard Jared and Pollard Codi
Current Estimated Value
Home Financials for this Owner
Home Financials are based on the most recent Mortgage that was taken out on this home.
Original Mortgage
$185,000
Outstanding Balance
$179,061
Interest Rate
6.58%
Mortgage Type
VA
Estimated Equity
$36,106
Purchase Details
Closed on
Feb 9, 2005
Sold by
Sutton Gary D
Bought by
Bridges Darren L and Bridges Jana C
Home Financials for this Owner
Home Financials are based on the most recent Mortgage that was taken out on this home.
Original Mortgage
$67,600
Interest Rate
5.85%
Mortgage Type
New Conventional
Purchase Details
Closed on
Mar 5, 2004
Sold by
Sutton Harry and Sutton Wilma
Purchase Details
Closed on
Jul 15, 1997
Sold by
Crowder Michael and Crowder Kelly
Purchase Details
Closed on
Jun 6, 1997
Sold by
Haines Billye Ann
Create a Home Valuation Report for This Property
The Home Valuation Report is an in-depth analysis detailing your home's value as well as a comparison with similar homes in the area
Home Values in the Area
Average Home Value in this Area
Purchase History
| Date | Buyer | Sale Price | Title Company |
|---|---|---|---|
| Pollard Jared | -- | Old Republic Title | |
| Bridges Darren L | $84,500 | Stewart Escrow & Title | |
| -- | -- | -- | |
| -- | $80,500 | -- | |
| -- | $79,000 | -- |
Source: Public Records
Mortgage History
| Date | Status | Borrower | Loan Amount |
|---|---|---|---|
| Open | Pollard Jared | $185,000 | |
| Previous Owner | Bridges Darren L | $67,600 |
Source: Public Records
Tax History Compared to Growth
Tax History
| Year | Tax Paid | Tax Assessment Tax Assessment Total Assessment is a certain percentage of the fair market value that is determined by local assessors to be the total taxable value of land and additions on the property. | Land | Improvement |
|---|---|---|---|---|
| 2025 | $1,685 | $19,037 | $1,233 | $17,804 |
| 2024 | $1,685 | $20,680 | $1,233 | $19,447 |
| 2023 | $1,199 | $15,011 | $1,233 | $13,778 |
| 2022 | $1,088 | $14,209 | $1,233 | $12,976 |
| 2021 | $1,055 | $13,398 | $1,233 | $12,165 |
| 2020 | $1,036 | $13,003 | $1,233 | $11,770 |
| 2019 | $1,006 | $12,624 | $1,233 | $11,391 |
| 2018 | $1,003 | $12,624 | $1,233 | $11,391 |
| 2017 | $937 | $11,900 | $1,233 | $10,667 |
| 2016 | $964 | $12,339 | $1,233 | $11,106 |
| 2015 | $928 | $11,980 | $1,233 | $10,747 |
| 2014 | $928 | $11,631 | $1,233 | $10,398 |
Source: Public Records
Map
Nearby Homes
- 2203 Canary Ave
- 2202 W Canary Ave
- 2120 2120 Flamingo Ln
- 2129 W Mallard Dr
- 2360 Rockwell Dr
- 2321 Rockwell Dr
- 1311 1311 N 20 St
- 1829 1829 Terrace Dr
- 1302 N 21st St
- 1212 1212 N 21st
- 2403 Meadow View Dr
- 2204 W Parkview Ave
- 1902 W Randall Ave
- 2230 W Spruce St
- 2206 2206 W Spruce
- 1807 W Chisholm Dr
- 2018 Woodrock Dr
- 1706 Windsor Dr
- 1099 N 19th St
- 1927 High Meadow Dr
- 2206 Flamingo Ln
- 2202 Flamingo Ln
- 2205 Canary Ave
- 2201 Canary Ave
- 2208 Flamingo Ln
- 2205 Flamingo Ln
- 2203 Flamingo Ln
- 2201 Flamingo Ln
- 2126 2126 Flamingo Ln
- 2207 Canary Ave
- 2126 Flamingo Ln
- 2207 Flamingo Ln
- 2109 Canary Ave
- 2307 Meadowview Dr
- 2127 Flamingo Ln
- 2204 Canary Ave
- 2124 Flamingo Ln
- 2204 Cardinal Ave
- 2202 Cardinal Ave
- 2202 Canary Ave