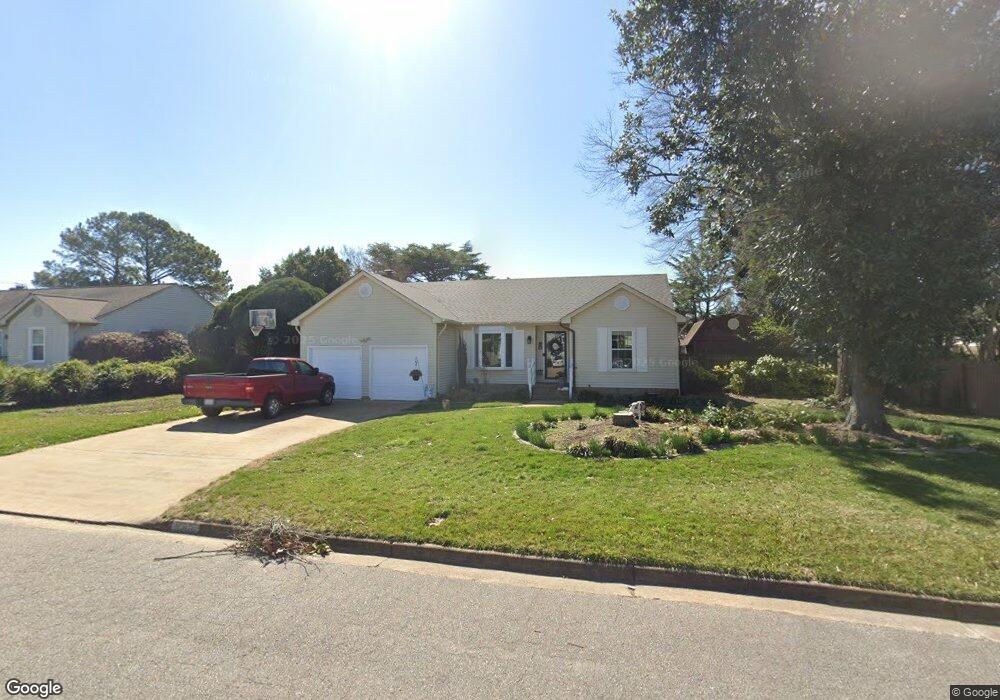
2204 Honeysuckle Ct Unit X3897 Virginia Beach, VA 23454
Great Neck NeighborhoodEstimated Value: $582,000 - $609,354
3
Beds
2
Baths
1,738
Sq Ft
$344/Sq Ft
Est. Value
About This Home
This home is located at 2204 Honeysuckle Ct Unit X3897, Virginia Beach, VA 23454 and is currently estimated at $597,839, approximately $343 per square foot. 2204 Honeysuckle Ct Unit X3897 is a home located in Virginia Beach City with nearby schools including John B. Dey Elementary School, Great Neck Middle School, and Frank W. Cox High School.
Ownership History
Date
Name
Owned For
Owner Type
Purchase Details
Closed on
Dec 15, 2020
Sold by
Bowen Bob O and Bowen Reina D
Bought by
Lewis Ryun J and Lewis Jessica H
Current Estimated Value
Home Financials for this Owner
Home Financials are based on the most recent Mortgage that was taken out on this home.
Original Mortgage
$445,005
Outstanding Balance
$396,187
Interest Rate
2.7%
Mortgage Type
VA
Estimated Equity
$201,652
Purchase Details
Closed on
Aug 22, 2014
Sold by
Breeden Glenn F
Bought by
Bowen Bob O
Home Financials for this Owner
Home Financials are based on the most recent Mortgage that was taken out on this home.
Original Mortgage
$354,050
Interest Rate
4.14%
Mortgage Type
New Conventional
Create a Home Valuation Report for This Property
The Home Valuation Report is an in-depth analysis detailing your home's value as well as a comparison with similar homes in the area
Home Values in the Area
Average Home Value in this Area
Purchase History
| Date | Buyer | Sale Price | Title Company |
|---|---|---|---|
| Lewis Ryun J | $435,000 | Fidelity National Ttl Ins Co | |
| Bowen Bob O | $365,000 | -- |
Source: Public Records
Mortgage History
| Date | Status | Borrower | Loan Amount |
|---|---|---|---|
| Open | Lewis Ryun J | $445,005 | |
| Previous Owner | Bowen Bob O | $354,050 |
Source: Public Records
Tax History Compared to Growth
Tax History
| Year | Tax Paid | Tax Assessment Tax Assessment Total Assessment is a certain percentage of the fair market value that is determined by local assessors to be the total taxable value of land and additions on the property. | Land | Improvement |
|---|---|---|---|---|
| 2025 | $4,963 | $505,800 | $260,000 | $245,800 |
| 2024 | $4,963 | $511,600 | $260,000 | $251,600 |
| 2023 | $4,693 | $474,000 | $245,000 | $229,000 |
| 2022 | $4,247 | $429,000 | $200,000 | $229,000 |
| 2021 | $3,987 | $402,700 | $185,000 | $217,700 |
| 2020 | $3,677 | $361,400 | $178,000 | $183,400 |
| 2019 | $3,758 | $379,100 | $180,000 | $199,100 |
| 2018 | $3,800 | $379,100 | $180,000 | $199,100 |
| 2017 | $3,744 | $373,500 | $178,000 | $195,500 |
| 2016 | $3,714 | $375,100 | $178,000 | $197,100 |
| 2015 | $3,571 | $360,700 | $177,700 | $183,000 |
| 2014 | $3,050 | $341,300 | $179,800 | $161,500 |
Source: Public Records
Map
Nearby Homes
- 2122 Sanctuary Ct
- 2121 Refuge Ct
- 2001 Belvidere Rd
- 1401 Water Mill Cir
- 2273 Tanglewood Trail
- 2313 Trant Lake Dr
- 1249 Paramore Dr
- 1040 Collection Creek Way
- 1299 Cutter Point
- 1815 Tree Line Rd
- 1532 Mirassou Ln
- 1108 Embassy Ct
- 1872 Eden Way
- 1721 Vintage Quay
- 1605 Dey Cove Dr
- 1601 Tether Keep
- 1417 Ashley Dr
- 1043 Hanson Way
- 1292 Holly Point Rd
- 1877 Calash Way
- 2200 Honeysuckle Ct
- 2208 Honeysuckle Ct
- 2205 Honeysuckle Ct Unit X3870
- 2209 Honeysuckle Ct
- 2201 Honeysuckle Ct
- 2213 Honeysuckle Ct
- 1301 Laurelfield Ct
- 1324 Laurelfield Ct
- 1305 Laurelfield Ct
- 1309 Laurelfield Ct
- 1328 Laurelfield Ct
- 1300 N Great Neck Rd
- 1313 Laurelfield Ct
- 1300 Willowood Ln
- 1279 N Great Neck Rd
- 1317 Laurelfield Ct
- 1336 Laurelfield Ct
- 1304 Willowood Ln
- 1332 Laurelfield Ct
- 1280 N Great Neck Rd