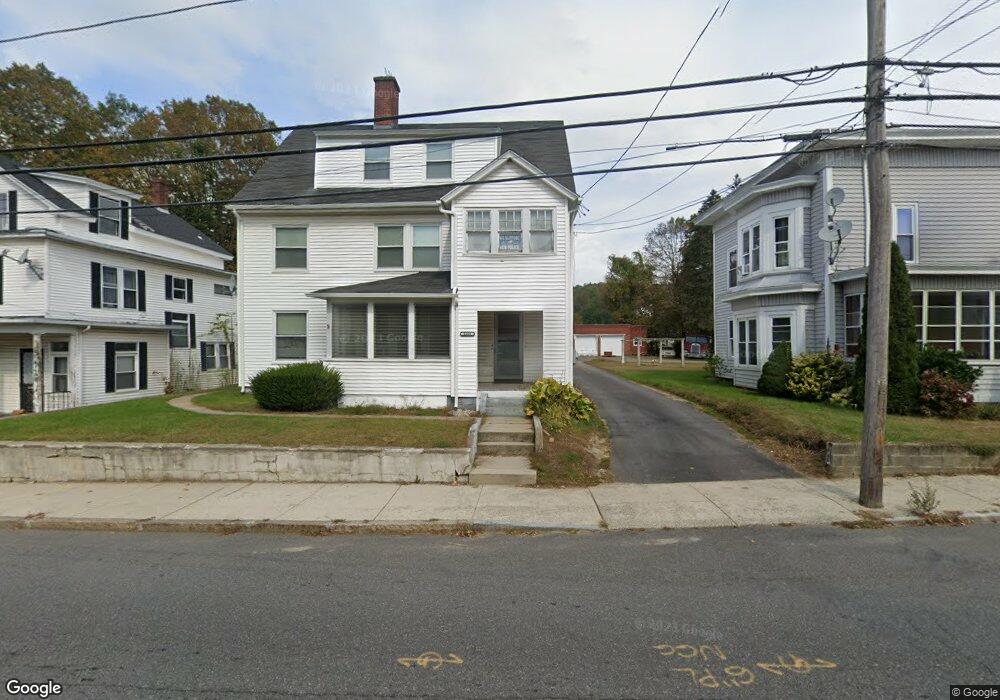
2204 Main St West Warren, MA 01092
Estimated Value: $298,884 - $486,000
7
Beds
2
Baths
3,322
Sq Ft
$115/Sq Ft
Est. Value
About This Home
This home is located at 2204 Main St, West Warren, MA 01092 and is currently estimated at $382,471, approximately $115 per square foot. 2204 Main St is a home located in Worcester County with nearby schools including Quaboag Regional High School.
Ownership History
Date
Name
Owned For
Owner Type
Purchase Details
Closed on
Mar 25, 2009
Sold by
Res Funding Co Llc
Bought by
Sullivan John
Current Estimated Value
Purchase Details
Closed on
Nov 26, 2008
Sold by
Tillotson Carrie and Res Funding Co Llc
Bought by
Us Bk
Purchase Details
Closed on
Jul 21, 2004
Sold by
Rys Ronald W
Bought by
Tillotson Carrie
Home Financials for this Owner
Home Financials are based on the most recent Mortgage that was taken out on this home.
Original Mortgage
$140,800
Interest Rate
6.28%
Mortgage Type
Purchase Money Mortgage
Create a Home Valuation Report for This Property
The Home Valuation Report is an in-depth analysis detailing your home's value as well as a comparison with similar homes in the area
Home Values in the Area
Average Home Value in this Area
Purchase History
| Date | Buyer | Sale Price | Title Company |
|---|---|---|---|
| Sullivan John | $74,000 | -- | |
| Us Bk | $143,650 | -- | |
| Tillotson Carrie | $176,000 | -- |
Source: Public Records
Mortgage History
| Date | Status | Borrower | Loan Amount |
|---|---|---|---|
| Previous Owner | Tillotson Carrie | $140,800 |
Source: Public Records
Tax History
| Year | Tax Paid | Tax Assessment Tax Assessment Total Assessment is a certain percentage of the fair market value that is determined by local assessors to be the total taxable value of land and additions on the property. | Land | Improvement |
|---|---|---|---|---|
| 2025 | $4,046 | $273,200 | $41,200 | $232,000 |
| 2024 | $4,117 | $273,200 | $41,200 | $232,000 |
| 2023 | $3,971 | $251,300 | $41,200 | $210,100 |
| 2022 | $3,496 | $224,700 | $35,500 | $189,200 |
| 2021 | $5,604 | $209,400 | $33,500 | $175,900 |
| 2020 | $3,358 | $195,700 | $33,500 | $162,200 |
| 2019 | $3,347 | $184,400 | $33,500 | $150,900 |
| 2018 | $3,078 | $177,700 | $33,500 | $144,200 |
| 2017 | $3,159 | $170,200 | $34,800 | $135,400 |
| 2016 | $3,224 | $162,500 | $33,100 | $129,400 |
| 2015 | $3,047 | $162,500 | $33,100 | $129,400 |
| 2014 | $3,104 | $162,500 | $33,100 | $129,400 |
Source: Public Records
Map
Nearby Homes
Your Personal Tour Guide
Ask me questions while you tour the home.