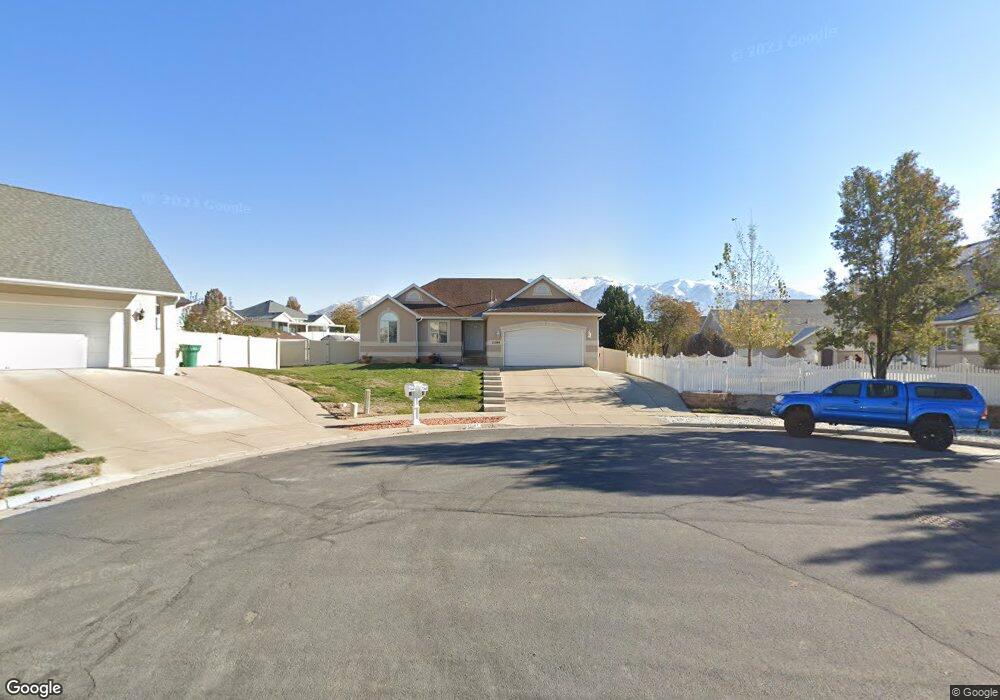
2204 N 700 W Layton, UT 84041
Estimated Value: $554,000 - $595,000
5
Beds
3
Baths
2,860
Sq Ft
$199/Sq Ft
Est. Value
About This Home
This home is located at 2204 N 700 W, Layton, UT 84041 and is currently estimated at $568,855, approximately $198 per square foot. 2204 N 700 W is a home located in Davis County with nearby schools including Lincoln Elementary School, North Layton Junior High School, and Northridge High School.
Ownership History
Date
Name
Owned For
Owner Type
Purchase Details
Closed on
May 24, 2011
Sold by
Eversole Julie and Eversole Kenneth G
Bought by
Herschbach Brian M and Herschbach Melinda
Current Estimated Value
Home Financials for this Owner
Home Financials are based on the most recent Mortgage that was taken out on this home.
Original Mortgage
$245,000
Outstanding Balance
$169,950
Interest Rate
4.84%
Mortgage Type
VA
Estimated Equity
$398,905
Purchase Details
Closed on
Aug 27, 2004
Sold by
Christensen Lesa K
Bought by
Eversole Julie and Eversole Kenneth G
Purchase Details
Closed on
Jun 21, 1999
Sold by
Christensen Brian J
Bought by
Christensen Lesa K
Purchase Details
Closed on
Oct 10, 1997
Sold by
Sli Commercial Real Estate Co
Bought by
Christensen Brian J and Christensen Lesa K
Home Financials for this Owner
Home Financials are based on the most recent Mortgage that was taken out on this home.
Original Mortgage
$179,600
Interest Rate
7.54%
Create a Home Valuation Report for This Property
The Home Valuation Report is an in-depth analysis detailing your home's value as well as a comparison with similar homes in the area
Home Values in the Area
Average Home Value in this Area
Purchase History
| Date | Buyer | Sale Price | Title Company |
|---|---|---|---|
| Herschbach Brian M | -- | Bonneville Superior | |
| Eversole Julie | -- | First American Title Co | |
| Christensen Lesa K | -- | -- | |
| Christensen Brian J | -- | Security Title Company |
Source: Public Records
Mortgage History
| Date | Status | Borrower | Loan Amount |
|---|---|---|---|
| Open | Herschbach Brian M | $245,000 | |
| Previous Owner | Christensen Brian J | $179,600 |
Source: Public Records
Tax History Compared to Growth
Tax History
| Year | Tax Paid | Tax Assessment Tax Assessment Total Assessment is a certain percentage of the fair market value that is determined by local assessors to be the total taxable value of land and additions on the property. | Land | Improvement |
|---|---|---|---|---|
| 2024 | -- | $270,049 | $135,628 | $134,421 |
| 2023 | $1,028 | $270,050 | $85,613 | $184,437 |
| 2022 | $1,028 | $499,000 | $152,641 | $346,359 |
| 2021 | $485 | $374,000 | $122,262 | $251,738 |
| 2020 | $204 | $326,000 | $100,964 | $225,036 |
| 2019 | $172 | $308,000 | $94,183 | $213,817 |
| 2018 | $58 | $285,000 | $94,183 | $190,817 |
| 2016 | $1,927 | $141,515 | $31,318 | $110,197 |
| 2015 | $1,850 | $128,975 | $31,318 | $97,657 |
| 2014 | $1,859 | $132,577 | $31,318 | $101,259 |
| 2013 | $1,936 | $130,714 | $26,884 | $103,830 |
Source: Public Records
Map
Nearby Homes
- 2378 N 675 W
- 2402 N 725 W
- 2211 N 525 W
- 781 W 2150 N
- 2187 N 450 W
- 1837 N 440 W
- 2875 N Hill Field Rd Unit 58
- 2875 N Hill Field Rd Unit 17
- 2875 N Hill Field Rd Unit 62
- 2600 N Hill Field Rd Unit 4
- 2600 N Hill Field Rd Unit 138
- 2500 N Fort Ln Unit 238
- 2500 N Fort Ln Unit 189
- 2048 Evans Cove Loop
- 65 Sunset Dr
- 2044 Evans Cove Loop
- 63 Sunset Dr
- 1676 Forbes Ave W
- 14 Lakeview Dr
- 1966 N 50 W