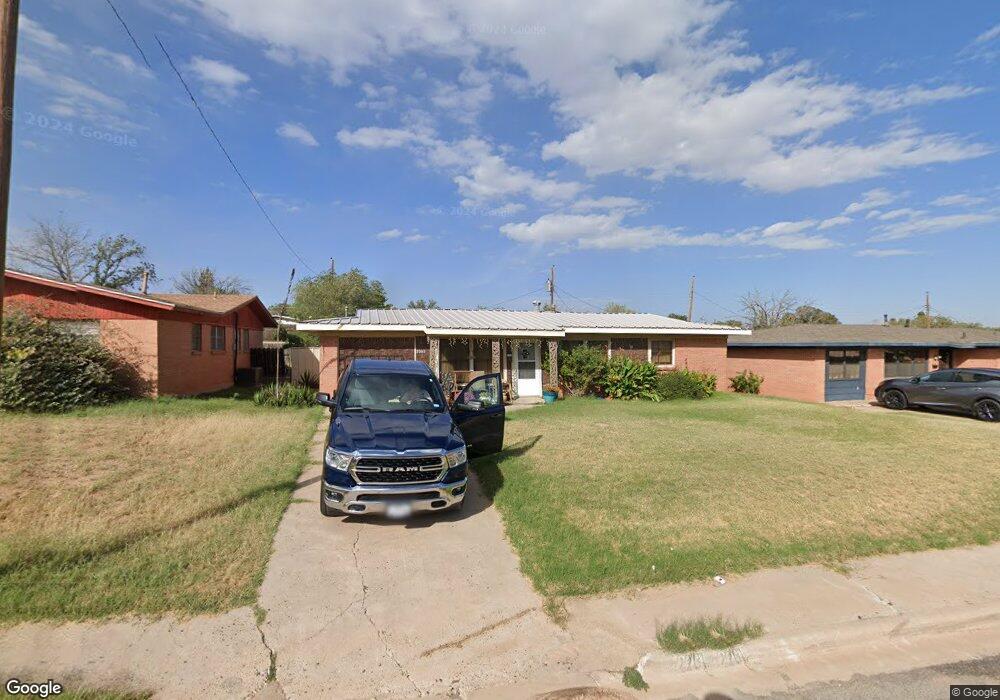
2205 Alabama St Big Spring, TX 79720
Estimated Value: $147,804 - $164,000
Studio
--
Bath
1,546
Sq Ft
$100/Sq Ft
Est. Value
About This Home
This home is located at 2205 Alabama St, Big Spring, TX 79720 and is currently estimated at $154,451, approximately $99 per square foot. 2205 Alabama St is a home located in Howard County with nearby schools including Big Spring High School.
Ownership History
Date
Name
Owned For
Owner Type
Purchase Details
Closed on
Apr 20, 2023
Sold by
Byrd Sherri Lynn
Bought by
Byrd Sherri Lynn and Byrd Billy Joe
Current Estimated Value
Home Financials for this Owner
Home Financials are based on the most recent Mortgage that was taken out on this home.
Original Mortgage
$174,000
Outstanding Balance
$161,869
Interest Rate
1.7%
Mortgage Type
Reverse Mortgage Home Equity Conversion Mortgage
Estimated Equity
-$7,418
Purchase Details
Closed on
Dec 12, 2022
Sold by
Jones Byrd Sherri
Bought by
Jones Byrd Sherri and Jones Joe Byrd
Purchase Details
Closed on
Jan 6, 2006
Sold by
Meissner Jackie I and Meissner Martin C
Bought by
Hill John P and Hill Sherri L
Home Financials for this Owner
Home Financials are based on the most recent Mortgage that was taken out on this home.
Original Mortgage
$51,000
Interest Rate
6.23%
Mortgage Type
Unknown
Create a Home Valuation Report for This Property
The Home Valuation Report is an in-depth analysis detailing your home's value as well as a comparison with similar homes in the area
Purchase History
| Date | Buyer | Sale Price | Title Company |
|---|---|---|---|
| Byrd Sherri Lynn | -- | Fnc Title | |
| Jones Byrd Sherri | -- | -- | |
| Hill John P | -- | None Available |
Source: Public Records
Mortgage History
| Date | Status | Borrower | Loan Amount |
|---|---|---|---|
| Open | Byrd Sherri Lynn | $174,000 | |
| Previous Owner | Hill John P | $51,000 | |
| Closed | Byrd Sherri Lynn | $0 |
Source: Public Records
Tax History
| Year | Tax Paid | Tax Assessment Tax Assessment Total Assessment is a certain percentage of the fair market value that is determined by local assessors to be the total taxable value of land and additions on the property. | Land | Improvement |
|---|---|---|---|---|
| 2025 | $1,065 | $123,696 | $7,240 | $116,456 |
| 2024 | $1,961 | $123,696 | $7,240 | $116,456 |
| 2023 | $1,766 | $124,227 | $5,254 | $118,973 |
| 2022 | $924 | $137,079 | $4,378 | $132,701 |
| 2021 | $1,946 | $82,801 | $4,378 | $78,423 |
| 2019 | $1,837 | $72,614 | $4,378 | $68,236 |
| 2018 | $2,136 | $73,561 | $4,378 | $69,183 |
| 2017 | $1,907 | $64,803 | $4,378 | $60,425 |
| 2016 | $1,935 | $65,747 | $4,378 | $61,369 |
| 2015 | -- | $64,362 | $4,378 | $59,984 |
| 2014 | -- | $63,601 | $1,251 | $62,350 |
Source: Public Records
Map
Nearby Homes
- Lot 31 Miami Cove
- Lot 25 Miami Cove
- 1908 Morrison Dr
- 2402 S Monticello St
- 1309 Marijo Ave
- 1304 Stanford Ave
- 1302 Barnes Ave
- 2004 N Monticello St
- 1710 Alabama St
- 1108 Stanford Ave
- 2308 Brent Dr
- 1800 Brent Dr
- 1600 E 17th St
- 1012 Baylor Blvd
- 2300 Cindy Ln
- 204 Jefferson St
- 202 Jefferson St
- 3206 Drexel Ave
- 1305 Lincoln Ave
- 1306 Monmouth Ave
- 2207 Alabama St
- 2203 Alabama St
- 2209 Alabama St
- 2208 Morrison Dr
- 2201 Alabama St
- 2206 Morrison Dr
- 2210 Morrison Dr
- 2204 Alabama St
- 2202 Alabama St
- 2301 Alabama St
- 2206 Alabama St
- 2107 Alabama St
- 2300 Morrison Dr
- 2200 Alabama St
- 2204 Morrison Dr
- 2208 Alabama St
- 2303 Alabama St
- 2104 Alabama St
- 2302 Morrison Dr
- 2105 Alabama St
Your Personal Tour Guide
Ask me questions while you tour the home.