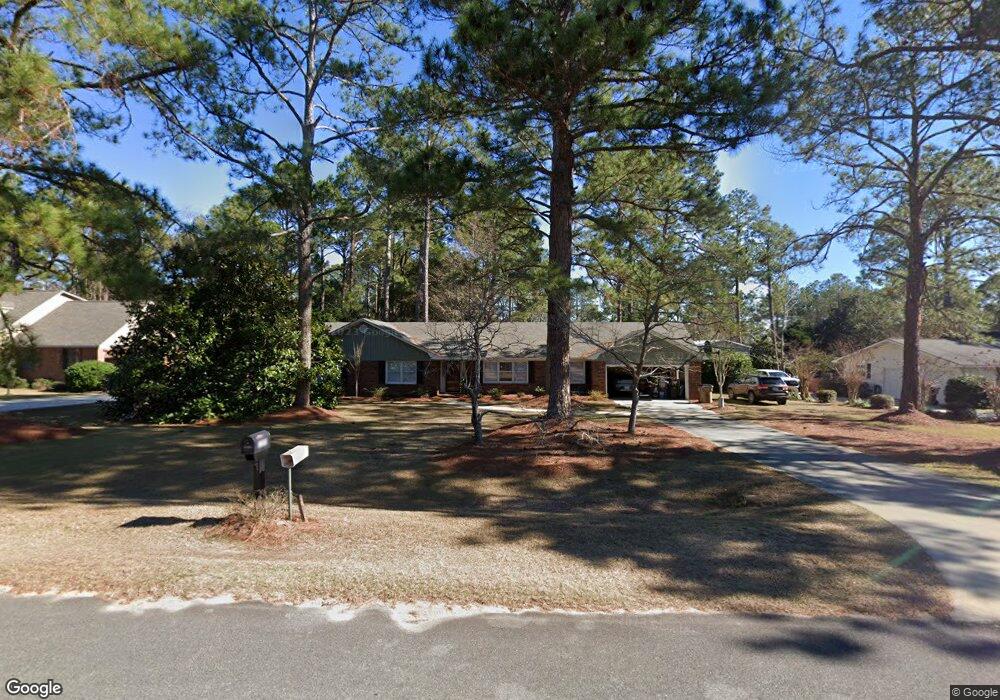
2205 Bateman Dr Tifton, GA 31793
Estimated Value: $250,205 - $320,000
3
Beds
2
Baths
1,732
Sq Ft
$167/Sq Ft
Est. Value
About This Home
This home is located at 2205 Bateman Dr, Tifton, GA 31793 and is currently estimated at $289,301, approximately $167 per square foot. 2205 Bateman Dr is a home located in Tift County with nearby schools including Annie Belle Clark Primary School, Matt Wilson Elementary School, and J.T. Reddick School.
Ownership History
Date
Name
Owned For
Owner Type
Purchase Details
Closed on
Mar 15, 1988
Sold by
Cella Tony R Bonnie D
Bought by
Burtle Gary J and Burtle Melissa B
Current Estimated Value
Purchase Details
Closed on
May 23, 1986
Sold by
Murhine Bobby J and Murhine Judith E
Bought by
Cella Tony R and Cella Bonn D
Purchase Details
Closed on
Oct 23, 1984
Sold by
Allen James M and Allen Rhonda G
Bought by
Murphine Bobby J and Murphine Judith E
Purchase Details
Closed on
May 20, 1980
Sold by
Thompson Marvin L and Thompson Willette R
Bought by
Allen James M and Allen Rhonda G
Purchase Details
Closed on
Oct 5, 1979
Sold by
Luke Julius D-Dba-Luke Contractor
Bought by
Thompson Marvin L and Thompson Willette R
Purchase Details
Closed on
Feb 27, 1978
Sold by
Pbm Investments Inc
Bought by
Luke Julius D Dba- Luke Contractor
Create a Home Valuation Report for This Property
The Home Valuation Report is an in-depth analysis detailing your home's value as well as a comparison with similar homes in the area
Home Values in the Area
Average Home Value in this Area
Purchase History
| Date | Buyer | Sale Price | Title Company |
|---|---|---|---|
| Burtle Gary J | $78,000 | -- | |
| Cella Tony R | $75,000 | -- | |
| Murphine Bobby J | $73,500 | -- | |
| Allen James M | $18,200 | -- | |
| Thompson Marvin L | $60,000 | -- | |
| Luke Julius D Dba- Luke Contractor | $5,700 | -- |
Source: Public Records
Tax History Compared to Growth
Tax History
| Year | Tax Paid | Tax Assessment Tax Assessment Total Assessment is a certain percentage of the fair market value that is determined by local assessors to be the total taxable value of land and additions on the property. | Land | Improvement |
|---|---|---|---|---|
| 2024 | $1,910 | $89,540 | $11,600 | $77,940 |
| 2023 | $1,757 | $63,159 | $6,800 | $56,359 |
| 2022 | $1,815 | $63,159 | $6,800 | $56,359 |
| 2021 | $1,826 | $63,159 | $6,800 | $56,359 |
| 2020 | $1,513 | $51,736 | $6,800 | $44,936 |
| 2019 | $1,510 | $51,736 | $6,800 | $44,936 |
| 2018 | $1,508 | $51,736 | $6,800 | $44,936 |
| 2017 | $1,515 | $51,736 | $6,800 | $44,936 |
| 2016 | $1,517 | $51,736 | $6,800 | $44,936 |
| 2015 | $1,517 | $51,736 | $6,800 | $44,936 |
| 2014 | $1,520 | $51,736 | $6,800 | $44,936 |
| 2013 | -- | $51,736 | $6,800 | $44,936 |
Source: Public Records
Map
Nearby Homes
- 2008 Rutland Rd Unit 10
- 2008 Rutland Rd
- 1808 Rutland Rd
- 26 Alan Ln
- 31 Henry Way
- 7 Deborah Dr
- 100 Elizabeth Dr
- 0 W Hutchinson Rd
- Tract 1 Whiddon Mill Rd
- 131 Oak Point Ave
- 106 Mill Ridge Cir
- W Hutchinson Rd
- 1901 Melba Dr
- 51 Logan Dr
- 1610 Mallard Ln
- 1607 Mallard Ln
- 9 Country Club Place
- 0 Carpenter Rd
- 577 Zion Hope Rd
- 11 Fairway Dr
- 2203 Bateman Dr
- 2207 Bateman Dr
- 4805 Frazier Cir
- 4809 Frazier Cir
- 0 Bateman Dr
- 4801 Frazier Cir
- 2209 Bateman Dr
- 4006 Royce Rd
- 2204 Bateman Dr
- 2208 Bateman Dr
- 2222 Bateman Dr
- 4607 Frazier Cir
- 4804 Frazier Cir
- 4802 Frazier Cir
- 4007 Royce Rd
- 2202 Rutland Rd
- 4005 Royce Rd
- 4002 Royce Rd
- 4603 Frazier Cir
- 2014 Rutland Rd