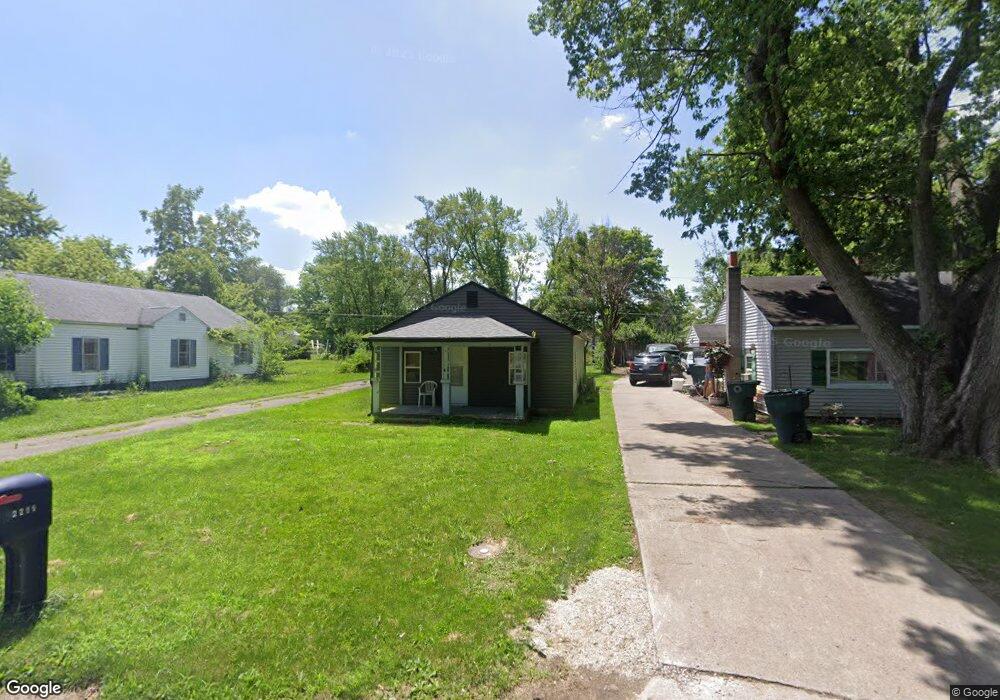
2205 E Cornell Ave Muncie, IN 47303
Morningside NeighborhoodEstimated Value: $50,000 - $70,353
2
Beds
1
Bath
800
Sq Ft
$80/Sq Ft
Est. Value
About This Home
This home is located at 2205 E Cornell Ave, Muncie, IN 47303 and is currently estimated at $63,838, approximately $79 per square foot. 2205 E Cornell Ave is a home located in Delaware County with nearby schools including Longfellow Elementary School, Muncie Central High School, and Northside Middle School.
Ownership History
Date
Name
Owned For
Owner Type
Purchase Details
Closed on
Aug 30, 2019
Sold by
Olin Gregory W and Martin Thelma Jean
Bought by
Dillard Gregory N
Current Estimated Value
Home Financials for this Owner
Home Financials are based on the most recent Mortgage that was taken out on this home.
Original Mortgage
$25,705
Outstanding Balance
$22,562
Interest Rate
3.7%
Mortgage Type
New Conventional
Estimated Equity
$41,276
Purchase Details
Closed on
Aug 25, 2017
Sold by
Olin Gregory W
Bought by
Olin Gregory W and Martin Thelma Jean
Purchase Details
Closed on
Apr 8, 2015
Sold by
Jp Morgan Chase Bank
Bought by
Olin Gregory W
Purchase Details
Closed on
Feb 11, 2015
Sold by
Delaware County Sheriff
Bought by
Jp Morgan Chase Bank
Purchase Details
Closed on
Apr 6, 2009
Sold by
Reynolds Mark and Reynolds Judith
Bought by
Farley Jana and Tuttle Jana L
Purchase Details
Closed on
Dec 1, 2006
Sold by
Hsbc Bank Usa
Bought by
Reynolds Mark and Reynolds Judith
Purchase Details
Closed on
Jul 24, 2006
Sold by
Glidden Thomas M and Glidden Sabrina M
Bought by
Hsbc Bank Usa
Purchase Details
Closed on
Aug 29, 2003
Sold by
Reynolds Mark and Reynolds Judith
Bought by
Farley Jana
Create a Home Valuation Report for This Property
The Home Valuation Report is an in-depth analysis detailing your home's value as well as a comparison with similar homes in the area
Home Values in the Area
Average Home Value in this Area
Purchase History
| Date | Buyer | Sale Price | Title Company |
|---|---|---|---|
| Dillard Gregory N | -- | None Available | |
| Olin Gregory W | -- | -- | |
| Olin Gregory W | $14,280 | -- | |
| Jp Morgan Chase Bank | $14,280 | -- | |
| Farley Jana | -- | Youngs Title | |
| Reynolds Mark | -- | None Available | |
| Hsbc Bank Usa | $36,453 | None Available | |
| Farley Jana | -- | None Available |
Source: Public Records
Mortgage History
| Date | Status | Borrower | Loan Amount |
|---|---|---|---|
| Open | Dillard Gregory N | $25,705 |
Source: Public Records
Tax History Compared to Growth
Tax History
| Year | Tax Paid | Tax Assessment Tax Assessment Total Assessment is a certain percentage of the fair market value that is determined by local assessors to be the total taxable value of land and additions on the property. | Land | Improvement |
|---|---|---|---|---|
| 2024 | $456 | $33,800 | $3,700 | $30,100 |
| 2023 | $416 | $29,800 | $3,700 | $26,100 |
| 2022 | $249 | $22,100 | $3,700 | $18,400 |
| 2021 | $235 | $20,400 | $2,200 | $18,200 |
| 2020 | $260 | $22,600 | $3,200 | $19,400 |
| 2019 | $261 | $23,000 | $3,200 | $19,800 |
| 2018 | $540 | $21,100 | $3,200 | $17,900 |
| 2017 | $520 | $20,100 | $3,200 | $16,900 |
| 2016 | $520 | $26,500 | $3,200 | $23,300 |
| 2014 | $253 | $29,400 | $4,000 | $25,400 |
| 2013 | -- | $29,100 | $4,000 | $25,100 |
Source: Public Records
Map
Nearby Homes
- 2103 E Yale Ave
- 3900 N Bellaire Ave
- 2309 E Depauw Ave
- 2220 E Dartmouth Ave
- 1915 E Purdue Rd
- 1720 E Cornell Ave
- 1720 E Yale Ave
- 2808 E Mcgalliard Rd
- 4605 N Terri Ln
- 2101 N Macedonia Ave
- 809 E Dunn Ave
- 2000 Doctor Martin Luther King Junior Blvd
- 307 E Charter Dr
- 2204 N Watt Ave
- 2900 E County Road 350 N
- 1311 E Butler St
- 300 W Horizon Rd
- 1630 N Granville Ave
- 210 E Ward Ave
- 825 N Brady St
- 2209 E Cornell Ave
- 2201 E Cornell Ave
- 2206 E Princeton Ave
- 3705 N Bellaire Ave
- 2121 E Cornell Ave
- 2126 E Princeton Ave
- 2204 E Cornell Ave
- 2120 E Princeton Ave
- 2226 E Princeton Ave
- 2124 E Cornell Ave
- 2216 E Cornell Ave
- 2116 E Princeton Ave
- 2220 E Cornell Ave
- 2205 E Princeton Ave
- 2108 E Princeton Ave
- 2201 E Princeton Ave
- 2213 E Yale Ave
- 2119 E Yale Ave
- 2125 E Princeton Ave
- 2221 E Princeton Ave