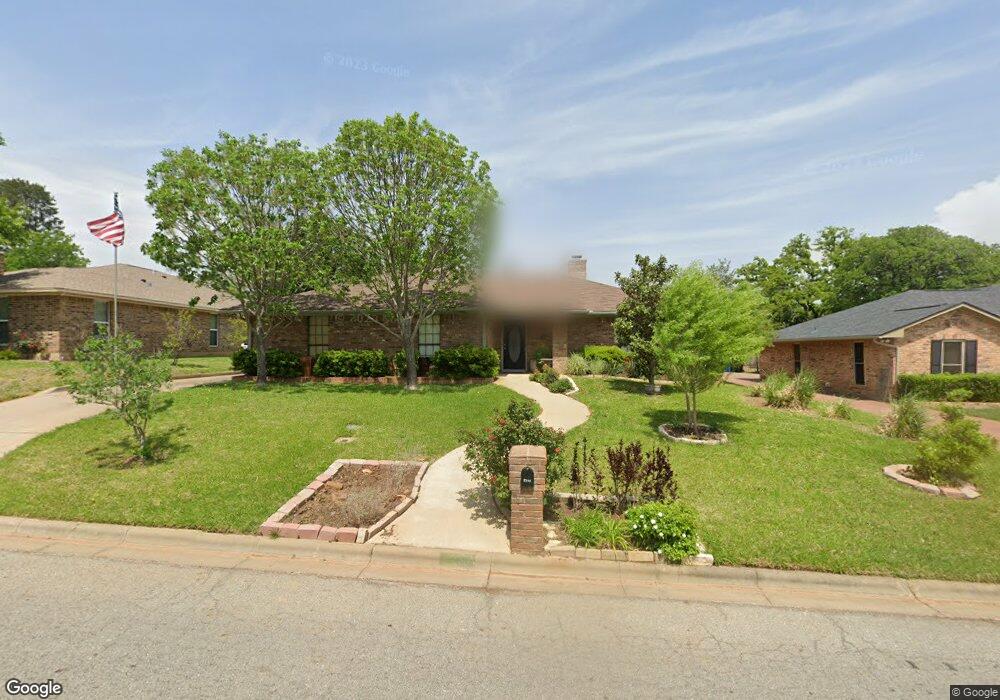
2205 Highland Park Dr Denison, TX 75020
Estimated Value: $326,000 - $344,312
4
Beds
3
Baths
2,244
Sq Ft
$149/Sq Ft
Est. Value
About This Home
This home is located at 2205 Highland Park Dr, Denison, TX 75020 and is currently estimated at $335,156, approximately $149 per square foot. 2205 Highland Park Dr is a home located in Grayson County with nearby schools including Hyde Park Elementary School, Scott Middle School, and Denison High School.
Ownership History
Date
Name
Owned For
Owner Type
Purchase Details
Closed on
Jun 25, 2025
Sold by
Hanson William Kevin
Bought by
Hanson William Kevin and Biggers Erin Nichols
Current Estimated Value
Purchase Details
Closed on
Feb 11, 2020
Sold by
Biggers Erin and Estate Of Robert Marion Hanson
Bought by
Hanson William Kevin
Purchase Details
Closed on
Nov 4, 2016
Sold by
Hall Rena S and Hall Gary
Bought by
Hanson Martha Wallace
Purchase Details
Closed on
Jul 13, 2009
Sold by
Hall Gary R
Bought by
Hall Rena S
Purchase Details
Closed on
Aug 30, 2005
Sold by
Radican James and Radican Linda G
Bought by
Hall Gary and Hall Rena
Home Financials for this Owner
Home Financials are based on the most recent Mortgage that was taken out on this home.
Original Mortgage
$100,000
Interest Rate
5.81%
Mortgage Type
Purchase Money Mortgage
Create a Home Valuation Report for This Property
The Home Valuation Report is an in-depth analysis detailing your home's value as well as a comparison with similar homes in the area
Home Values in the Area
Average Home Value in this Area
Purchase History
| Date | Buyer | Sale Price | Title Company |
|---|---|---|---|
| Hanson William Kevin | -- | None Listed On Document | |
| Hanson William Kevin | -- | None Available | |
| Hanson William Kevin | -- | None Available | |
| Hanson David Conally | -- | None Available | |
| Hanson Martha Wallace | -- | Grayson County Title | |
| Hall Rena S | -- | None Available | |
| Hall Gary | -- | -- |
Source: Public Records
Mortgage History
| Date | Status | Borrower | Loan Amount |
|---|---|---|---|
| Previous Owner | Hall Gary | $100,000 |
Source: Public Records
Tax History Compared to Growth
Tax History
| Year | Tax Paid | Tax Assessment Tax Assessment Total Assessment is a certain percentage of the fair market value that is determined by local assessors to be the total taxable value of land and additions on the property. | Land | Improvement |
|---|---|---|---|---|
| 2025 | $6,373 | $333,771 | $64,561 | $269,210 |
| 2024 | $7,739 | $333,108 | $0 | $0 |
| 2023 | $5,496 | $302,825 | $0 | $0 |
| 2022 | $7,254 | $305,314 | $44,588 | $260,726 |
| 2021 | $6,312 | $250,268 | $39,245 | $211,023 |
| 2020 | $6,312 | $239,278 | $21,374 | $217,904 |
| 2019 | $6,444 | $234,181 | $21,374 | $212,807 |
| 2018 | $6,166 | $222,274 | $21,374 | $200,900 |
| 2017 | $5,807 | $207,574 | $19,272 | $188,302 |
| 2016 | $4,879 | $179,454 | $18,746 | $160,708 |
| 2015 | $2,533 | $158,553 | $18,133 | $140,420 |
| 2014 | $2,683 | $159,413 | $18,133 | $141,280 |
Source: Public Records
Map
Nearby Homes
- 1838 Park Ave
- 2100 Deer Run
- 2131 Deer Run
- 1803 Woodland Park Dr
- 2111 Renaissance Dr
- 2108 Turtlecreek
- 2206 Bluebonnet Ave
- 2606 Easy St
- 2406 Loy Lake Rd
- 2644 Loy Lake Rd
- TBD Bluebonnet Ave
- 3014 Loy Lake Rd
- 3016 Loy Lake Rd
- 527 W Coffin St
- 2014 Jerry Ave
- 1130 Amsden Cir
- 3312 Vine Ln
- 1901 Woodlawn Blvd
- 2408 Debra Ave
- 0 S Maurice Ave
- 2203 Highland Park Dr
- 2207 Highland Park Dr
- 2202 Park Cir
- 2209 Highland Park Dr
- 2801 Pyramid Cir
- 2204 Park Cir
- 2200 Park Cir
- 2201 Highland Park Dr
- 2409 Highland Park Dr
- TBD Highland Park Dr
- 2803 Pyramid Cir
- 2205 Park Cir
- 2210 Highland Park Dr
- 2710 Venture Cir
- 2708 Venture Cir
- 2804 Venture Cir
- 2706 Venture Cir
- 3201 S Park Ave
- 2203 Park Cir
- 2704 Venture Cir