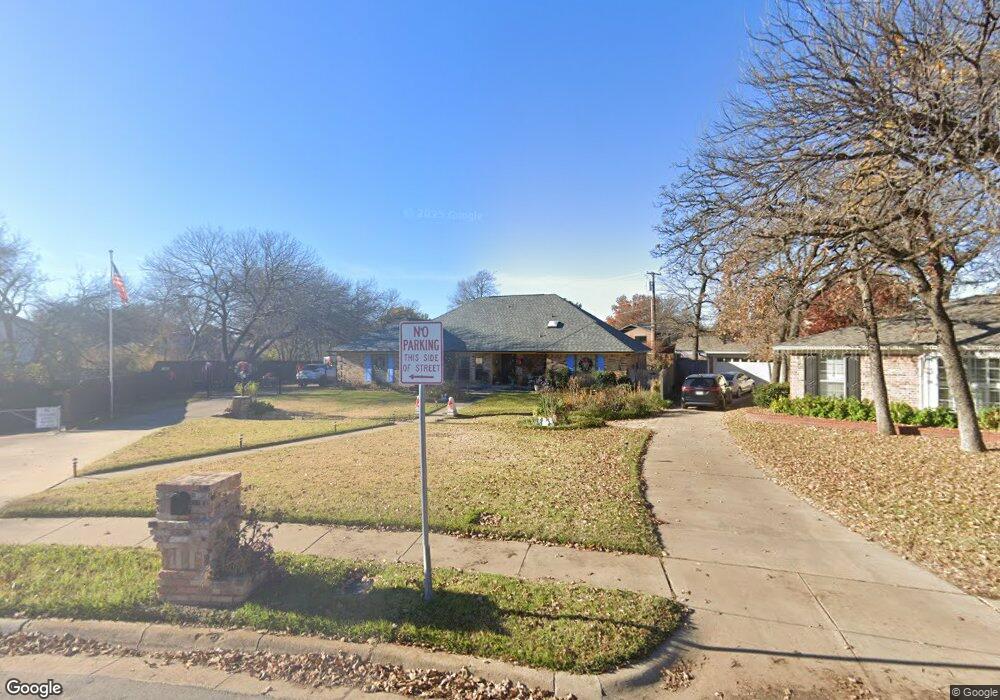
2205 Lakeview Dr Bedford, TX 76021
Estimated Value: $397,000 - $437,000
3
Beds
2
Baths
2,072
Sq Ft
$202/Sq Ft
Est. Value
About This Home
This home is located at 2205 Lakeview Dr, Bedford, TX 76021 and is currently estimated at $418,569, approximately $202 per square foot. 2205 Lakeview Dr is a home located in Tarrant County with nearby schools including Shady Brook Elementary School, Bedford Junior High School, and L.D. Bell High School.
Ownership History
Date
Name
Owned For
Owner Type
Purchase Details
Closed on
Jul 2, 2008
Sold by
Barnett Jeffrey and Barnett Wendy
Bought by
Vanderveen Thomas and Vanderveen Marisa M
Current Estimated Value
Purchase Details
Closed on
Oct 18, 2007
Sold by
Coulson Gary Don and Coulson Jackie Lois
Bought by
Barnett Jeffrey and Barnett Wendy
Home Financials for this Owner
Home Financials are based on the most recent Mortgage that was taken out on this home.
Original Mortgage
$155,000
Interest Rate
6.32%
Mortgage Type
Purchase Money Mortgage
Purchase Details
Closed on
Aug 22, 2001
Sold by
Shawn Karen and Shawn Michael
Bought by
Coulson Gary Don and Coulson Jackie Lois
Home Financials for this Owner
Home Financials are based on the most recent Mortgage that was taken out on this home.
Original Mortgage
$164,350
Interest Rate
7.16%
Purchase Details
Closed on
May 11, 2000
Sold by
Roberson Frank Lynn
Bought by
Roberson Karen L
Create a Home Valuation Report for This Property
The Home Valuation Report is an in-depth analysis detailing your home's value as well as a comparison with similar homes in the area
Home Values in the Area
Average Home Value in this Area
Purchase History
| Date | Buyer | Sale Price | Title Company |
|---|---|---|---|
| Vanderveen Thomas | -- | Hexter Fair Title Company | |
| Barnett Jeffrey | -- | Hexter Fair Title Company | |
| Coulson Gary Don | -- | American Title Co | |
| Roberson Karen L | -- | -- |
Source: Public Records
Mortgage History
| Date | Status | Borrower | Loan Amount |
|---|---|---|---|
| Previous Owner | Barnett Jeffrey | $155,000 | |
| Previous Owner | Coulson Gary Don | $164,350 |
Source: Public Records
Tax History Compared to Growth
Tax History
| Year | Tax Paid | Tax Assessment Tax Assessment Total Assessment is a certain percentage of the fair market value that is determined by local assessors to be the total taxable value of land and additions on the property. | Land | Improvement |
|---|---|---|---|---|
| 2025 | $1,978 | $400,434 | $85,000 | $315,434 |
| 2024 | $1,978 | $400,434 | $85,000 | $315,434 |
| 2023 | $6,349 | $331,017 | $85,000 | $246,017 |
| 2022 | $7,032 | $321,958 | $85,000 | $236,958 |
| 2021 | $7,275 | $311,476 | $85,000 | $226,476 |
| 2020 | $6,676 | $280,782 | $85,000 | $195,782 |
| 2019 | $6,932 | $285,349 | $88,000 | $197,349 |
| 2018 | $3,630 | $262,590 | $88,000 | $174,590 |
| 2017 | $5,775 | $270,340 | $27,500 | $242,840 |
| 2016 | $5,250 | $217,016 | $27,500 | $189,516 |
| 2015 | $3,612 | $230,740 | $27,500 | $203,240 |
| 2014 | $3,612 | $192,700 | $27,500 | $165,200 |
Source: Public Records
Map
Nearby Homes
- 2225 Shady Brook Dr
- 2317 Shady Grove Dr
- 49 Morrow Dr
- 31 Morrow Dr
- 18 Park Ln
- 6 Park Ln
- 2116 Tamworth Ct
- 2501 Shady Grove Dr
- 2508 Lakeview Dr
- 2420 Stonegate Dr N
- 2503 Shady Ridge Dr
- 2524 Shady Ridge Dr
- 1601 Warwickshire Ct W
- 2700 Shady Grove Dr
- 2436 Brookgreen Ct
- 2704 Shady Grove Dr
- 345 Somerset Cir
- 817 Shady Lake Dr
- 258 Somerset Terrace
- 1013 Springdale Rd
- 2209 Lakeview Dr
- 1209 Shady Ln
- 2208 Shady Grove Dr
- 2212 Shady Grove Dr
- 2201 Lakeview Dr
- 1213 Shady Ln
- 1205 Shady Ln
- 2204 Shady Grove Dr
- 2216 Shady Grove Dr
- 2213 Lakeview Dr
- 2200 Shady Grove Dr
- 2220 Shady Grove Dr
- 2217 Lakeview Dr
- 2168 Loma Alta Dr
- 2209 Shady Grove Dr
- 2213 Shady Grove Dr
- 2224 Shady Grove Dr
- 1212 Shady Ln
- 1208 Shady Ln
- 1216 Shady Ln