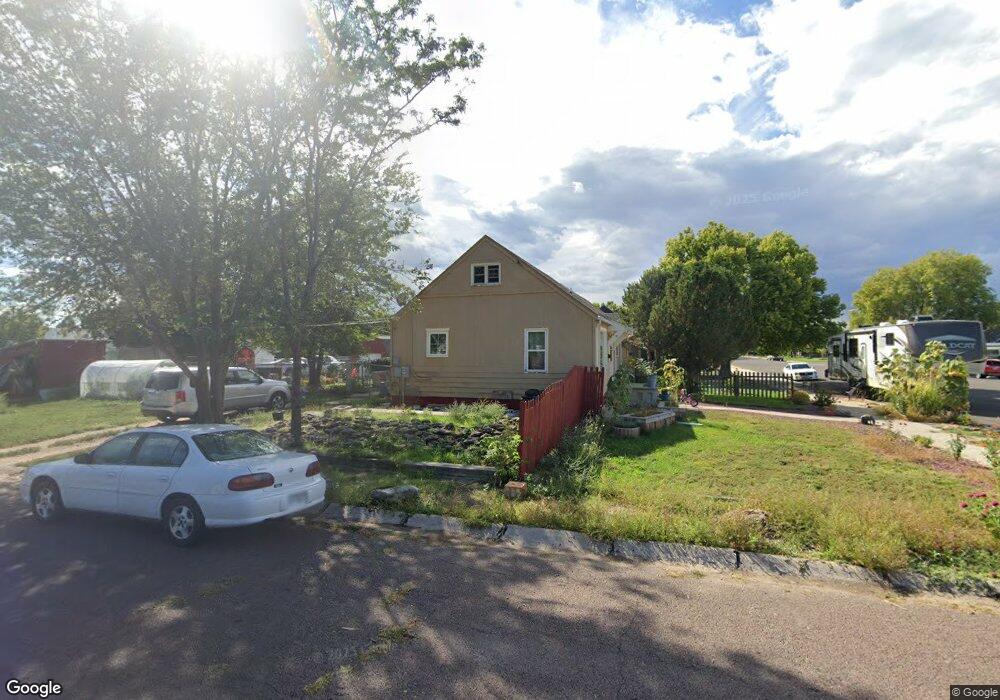
2205 Maple St Sidney, NE 69162
Estimated Value: $106,873 - $135,000
2
Beds
1
Bath
720
Sq Ft
$171/Sq Ft
Est. Value
About This Home
This home is located at 2205 Maple St, Sidney, NE 69162 and is currently estimated at $122,968, approximately $170 per square foot. 2205 Maple St is a home located in Cheyenne County with nearby schools including Central Elementary School, South Ward Elementary School, and North Ward Elementary School.
Ownership History
Date
Name
Owned For
Owner Type
Purchase Details
Closed on
Aug 31, 2018
Bought by
Flynn Tracey and Bilbrey Kelly R
Current Estimated Value
Purchase Details
Closed on
Jul 25, 2008
Sold by
Kocontes Lonnie
Bought by
Giese Marlon M and Giese Jill T
Home Financials for this Owner
Home Financials are based on the most recent Mortgage that was taken out on this home.
Original Mortgage
$38,950
Interest Rate
6.29%
Purchase Details
Closed on
Jun 19, 2008
Sold by
The Kern Trust
Bought by
Kocontes Lonnie
Home Financials for this Owner
Home Financials are based on the most recent Mortgage that was taken out on this home.
Original Mortgage
$38,950
Interest Rate
6.29%
Create a Home Valuation Report for This Property
The Home Valuation Report is an in-depth analysis detailing your home's value as well as a comparison with similar homes in the area
Home Values in the Area
Average Home Value in this Area
Purchase History
| Date | Buyer | Sale Price | Title Company |
|---|---|---|---|
| Flynn Tracey | $60,000 | -- | |
| Giese Marlon M | -- | -- | |
| Kocontes Lonnie | -- | -- |
Source: Public Records
Mortgage History
| Date | Status | Borrower | Loan Amount |
|---|---|---|---|
| Previous Owner | Giese Marlon M | $38,950 |
Source: Public Records
Tax History
| Year | Tax Paid | Tax Assessment Tax Assessment Total Assessment is a certain percentage of the fair market value that is determined by local assessors to be the total taxable value of land and additions on the property. | Land | Improvement |
|---|---|---|---|---|
| 2025 | $1,349 | $75,715 | $11,570 | $64,145 |
| 2024 | $1,282 | $69,464 | $10,614 | $58,850 |
| 2023 | $1,577 | $69,733 | $10,614 | $59,119 |
| 2022 | $1,480 | $63,874 | $10,614 | $53,260 |
| 2021 | $1,647 | $70,444 | $10,614 | $59,830 |
| 2020 | $1,481 | $63,431 | $9,231 | $54,200 |
| 2019 | $834 | $36,006 | $9,231 | $26,775 |
| 2018 | $1,095 | $48,299 | $10,728 | $37,571 |
| 2017 | $1,256 | $56,161 | $12,474 | $43,687 |
| 2016 | $1,201 | $56,161 | $12,474 | $43,687 |
| 2015 | $1,215 | $56,161 | $12,474 | $43,687 |
| 2014 | $1,247 | $55,606 | $12,474 | $43,132 |
Source: Public Records
Map
Nearby Homes
- 1905 Sidney Draw Rd
- 1539 Jackson St
- 1229 Linden St
- 2446 El Rancho Rd
- 801 Deervalley Dr
- 801 Deer Valley Dr
- 4674 Highway 385
- 34414 County Road 53
- 0 Road 50
- 4819 Road 125
- 4667 Cr 129
- 33216 County Road 75
- Tbd Road 32
- TBD Road 143
- 9178 Road 48
- 1430 Road 145
- 32307 County Road 75
- TBD Lot #4 Cr 32
- Tbd Road 143
- 3860 Road 83
Your Personal Tour Guide
Ask me questions while you tour the home.