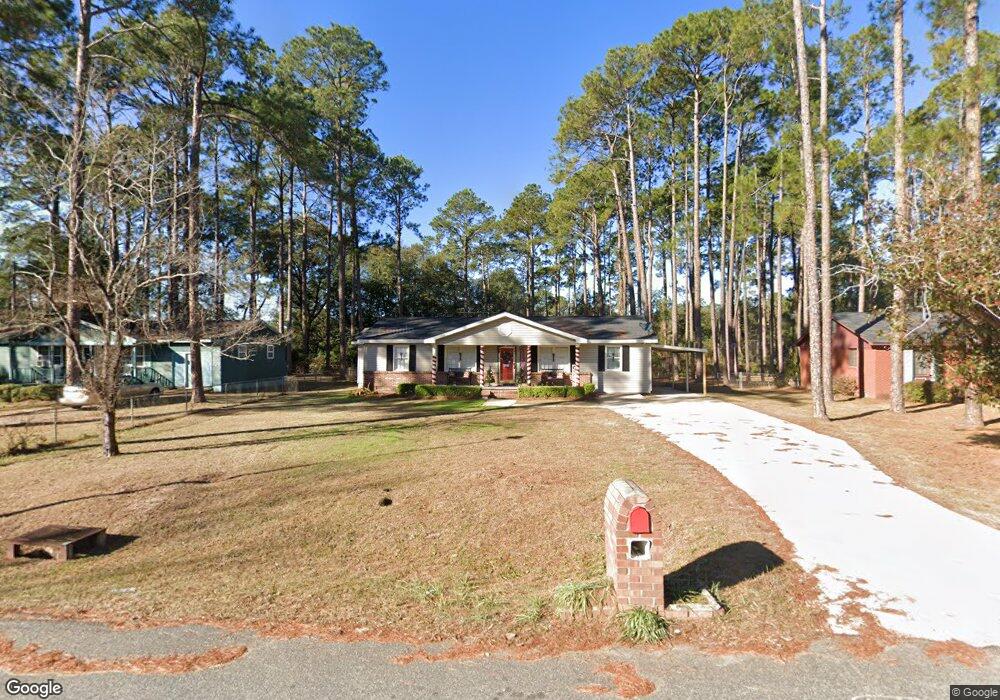
2205 Oxford Rd Albany, GA 31721
Estimated Value: $124,000 - $152,000
3
Beds
2
Baths
1,804
Sq Ft
$76/Sq Ft
Est. Value
About This Home
This home is located at 2205 Oxford Rd, Albany, GA 31721 and is currently estimated at $137,768, approximately $76 per square foot. 2205 Oxford Rd is a home located in Dougherty County with nearby schools including Alice Coachman Elementary School, Southside Middle School, and Monroe High School.
Ownership History
Date
Name
Owned For
Owner Type
Purchase Details
Closed on
Apr 15, 2022
Sold by
Williams Novella A
Bought by
Floyd Christine M
Current Estimated Value
Home Financials for this Owner
Home Financials are based on the most recent Mortgage that was taken out on this home.
Original Mortgage
$90,500
Outstanding Balance
$73,405
Interest Rate
3.09%
Mortgage Type
New Conventional
Estimated Equity
$64,363
Purchase Details
Closed on
May 14, 2012
Sold by
Walker Daisy Stephens
Bought by
Williams Novella A
Home Financials for this Owner
Home Financials are based on the most recent Mortgage that was taken out on this home.
Original Mortgage
$81,380
Interest Rate
3.75%
Mortgage Type
FHA
Purchase Details
Closed on
Nov 30, 1997
Sold by
Handsford Melanie Denise
Bought by
Walker Daisy Stephens
Purchase Details
Closed on
Nov 29, 1997
Sold by
Walker James Edward and Dione Samantha
Bought by
Walker Daisy Stephens
Purchase Details
Closed on
Feb 15, 1984
Sold by
Blackshear Dan Etal
Bought by
Walker James and Daisy Stephens
Create a Home Valuation Report for This Property
The Home Valuation Report is an in-depth analysis detailing your home's value as well as a comparison with similar homes in the area
Home Values in the Area
Average Home Value in this Area
Purchase History
| Date | Buyer | Sale Price | Title Company |
|---|---|---|---|
| Floyd Christine M | $120,500 | -- | |
| Williams Novella A | $83,500 | -- | |
| Walker Daisy Stephens | -- | -- | |
| Walker Daisy Stephens | -- | -- | |
| Walker James | -- | -- |
Source: Public Records
Mortgage History
| Date | Status | Borrower | Loan Amount |
|---|---|---|---|
| Open | Floyd Christine M | $90,500 | |
| Previous Owner | Williams Novella A | $81,380 |
Source: Public Records
Tax History Compared to Growth
Tax History
| Year | Tax Paid | Tax Assessment Tax Assessment Total Assessment is a certain percentage of the fair market value that is determined by local assessors to be the total taxable value of land and additions on the property. | Land | Improvement |
|---|---|---|---|---|
| 2024 | $1,634 | $34,240 | $3,200 | $31,040 |
| 2023 | $1,595 | $34,240 | $3,200 | $31,040 |
| 2022 | $1,418 | $30,320 | $3,200 | $27,120 |
| 2021 | $1,315 | $30,320 | $3,200 | $27,120 |
| 2020 | $1,318 | $30,320 | $3,200 | $27,120 |
| 2019 | $1,323 | $30,320 | $3,200 | $27,120 |
| 2018 | $1,328 | $30,320 | $3,200 | $27,120 |
| 2017 | $1,237 | $30,320 | $3,200 | $27,120 |
| 2016 | $1,238 | $30,320 | $3,200 | $27,120 |
| 2015 | $1,241 | $30,320 | $3,200 | $27,120 |
| 2014 | $1,197 | $29,600 | $2,480 | $27,120 |
Source: Public Records
Map
Nearby Homes
- 2101 Goldendale Ln
- 2307 Evergreen Dr
- 6102 Newton Rd
- 2303 Joel Dr
- 2102 Techwood Dr
- 1918 Colquitt Ave
- 1104 University St
- 5404 Paulk Dr
- 1029 Davidson Dr
- 5407 Paulk Dr
- 1513 Colquitt Ave
- 2013 Jones Ave
- 5616 Newton Rd
- 802 Colquitt Cir
- 1409 Colquitt Ave
- 1003 University St
- 1610 W Gordon Ave
- 1705 W Gordon Ave
- 1804 W Lincoln Ave
- 1714 W Lincoln Ave
- 2203 Oxford Rd
- 2207 Oxford Rd
- 2209 Oxford Rd
- 2100 Goldendale Ln
- 2211 Oxford Rd
- 2102 Goldendale Ln
- 2104 Goldendale Ln
- 2213 Oxford Rd
- 2202 Oxford Rd
- 2206 Oxford Rd
- 2218 Kirkwood Rd
- 2216 Kirkwood Rd
- 2208 Oxford Rd
- 2214 Kirkwood Rd
- 2210 Oxford Rd
- 2200 Oxford Rd
- 2328 Oxford Rd
- 2213 Kirkwood Rd
- 2330 Oxford Rd
- 2307 Juniper Dr