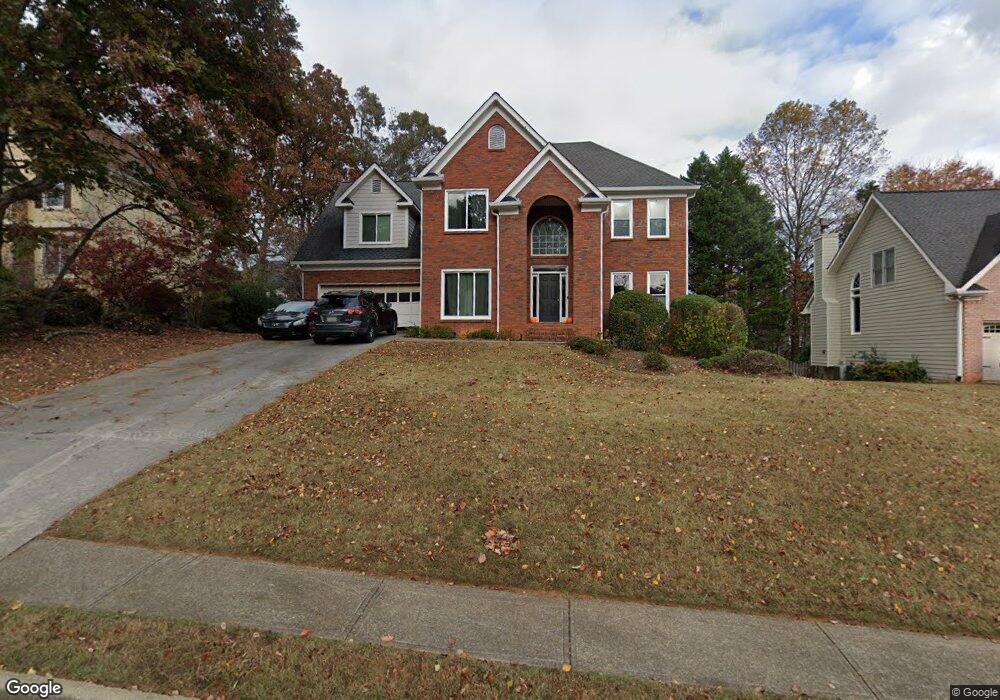
2205 Prickly Pear Walk Unit IV Lawrenceville, GA 30043
Estimated Value: $448,141 - $491,000
4
Beds
4
Baths
2,680
Sq Ft
$176/Sq Ft
Est. Value
About This Home
This home is located at 2205 Prickly Pear Walk Unit IV, Lawrenceville, GA 30043 and is currently estimated at $472,785, approximately $176 per square foot. 2205 Prickly Pear Walk Unit IV is a home located in Gwinnett County with nearby schools including Jackson Elementary School, Northbrook Middle School, and Peachtree Ridge High School.
Ownership History
Date
Name
Owned For
Owner Type
Purchase Details
Closed on
Sep 25, 2002
Sold by
Ronco Ronald R
Bought by
Ronco Ronald R and Ronco Lauren
Current Estimated Value
Purchase Details
Closed on
Jul 23, 2001
Sold by
Ronco Ronald R
Bought by
Ronco Ronald R and Ronco Lauren
Home Financials for this Owner
Home Financials are based on the most recent Mortgage that was taken out on this home.
Original Mortgage
$202,980
Interest Rate
7.08%
Mortgage Type
VA
Purchase Details
Closed on
Mar 17, 1995
Sold by
Finch Charles Inc
Bought by
Nolan Mark J Kathleen A
Purchase Details
Closed on
Dec 31, 1993
Sold by
White Oak Place Unit Iii
Bought by
Finch Charles Inc
Home Financials for this Owner
Home Financials are based on the most recent Mortgage that was taken out on this home.
Original Mortgage
$129,000
Interest Rate
7.09%
Mortgage Type
Construction
Create a Home Valuation Report for This Property
The Home Valuation Report is an in-depth analysis detailing your home's value as well as a comparison with similar homes in the area
Home Values in the Area
Average Home Value in this Area
Purchase History
| Date | Buyer | Sale Price | Title Company |
|---|---|---|---|
| Ronco Ronald R | -- | -- | |
| Ronco Ronald R | -- | -- | |
| Ronco Ronald R | $205,000 | -- | |
| Nolan Mark J Kathleen A | $178,700 | -- | |
| Finch Charles Inc | $32,000 | -- |
Source: Public Records
Mortgage History
| Date | Status | Borrower | Loan Amount |
|---|---|---|---|
| Previous Owner | Ronco Ronald R | $202,980 | |
| Previous Owner | Finch Charles Inc | $129,000 | |
| Closed | Nolan Mark J Kathleen A | $0 |
Source: Public Records
Tax History Compared to Growth
Tax History
| Year | Tax Paid | Tax Assessment Tax Assessment Total Assessment is a certain percentage of the fair market value that is determined by local assessors to be the total taxable value of land and additions on the property. | Land | Improvement |
|---|---|---|---|---|
| 2025 | $5,388 | $202,800 | $36,000 | $166,800 |
| 2024 | $5,039 | $178,440 | $34,000 | $144,440 |
| 2023 | $5,039 | $178,440 | $34,000 | $144,440 |
| 2022 | $4,524 | $155,040 | $32,400 | $122,640 |
| 2021 | $3,838 | $119,040 | $24,160 | $94,880 |
| 2020 | $3,865 | $119,040 | $24,160 | $94,880 |
| 2019 | $3,761 | $119,040 | $24,160 | $94,880 |
| 2018 | $3,666 | $114,400 | $22,720 | $91,680 |
| 2016 | $3,346 | $98,640 | $25,600 | $73,040 |
| 2015 | $3,050 | $83,760 | $19,200 | $64,560 |
| 2014 | -- | $83,760 | $19,200 | $64,560 |
Source: Public Records
Map
Nearby Homes
- 1015 Rowe Oak Cir
- 1021 Slash Pine Ct
- 955 Pointers Way
- 2117 Whitfield Ln
- 2210 Ashley Crossing Ct Unit 2
- 804 Bankshire Dr
- 868 Ashley Crossing Ln
- 1420 Midland Way
- 1171 Malvern Hunt Ct
- 2175 Golden Valley Dr
- 1955 Suwanee Valley Rd Unit 1
- 916 Tab Roberts Rd
- 2071 Morning Brook Cir Unit 3
- 1974 Hunt Crossing Ct Unit 1
- 2021 Huntcliff Dr Unit 1
- 2409 Birkhall Way
- 1202 Little Hawk Place Unit 1
- 741 Saddle Wood Way
- 1261 Birkhall Dr
- 1090 Steeple Run Unit 2
- 2195 Prickly Pear Walk
- 2215 Prickly Pear Walk Unit 4
- 2160 Deans Landing Dr Unit 1
- 2150 Deans Landing Dr
- 2185 Prickly Pear Walk Unit 6
- 2225 Prickly Pear Walk Unit 18
- 2225 Prickly Pear Walk
- 2140 Deans Landing Dr Unit 10
- 2140 Deans Landing Dr
- 1005 Rowe Oak Cir
- 2170 Deans Landing Dr Unit 1
- 2210 Prickly Pear Walk
- 1006 Slash Pine Ct
- 2130 Deans Landing Dr
- 2180 Deans Landing Dr Unit 1
- 2175 Prickly Pear Walk Unit 6
- 0 Deans Landing Dr Unit 7240401
- 0 Deans Landing Dr Unit 8096488
- 2235 Prickly Pear Walk Unit IV
- 2155 Deans Landing Dr