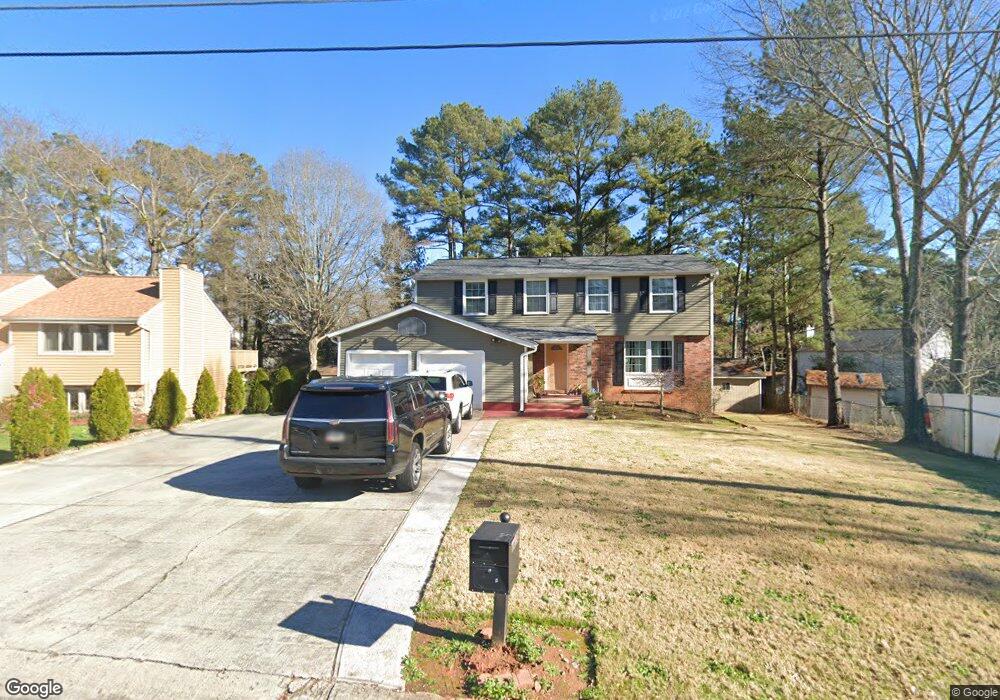
2205 Ranch Trail Unit 6 Norcross, GA 30071
Estimated Value: $365,000 - $404,000
4
Beds
3
Baths
2,024
Sq Ft
$191/Sq Ft
Est. Value
About This Home
This home is located at 2205 Ranch Trail Unit 6, Norcross, GA 30071 and is currently estimated at $385,741, approximately $190 per square foot. 2205 Ranch Trail Unit 6 is a home located in Gwinnett County with nearby schools including Beaver Ridge Elementary School, Summerour Middle School, and Norcross High School.
Ownership History
Date
Name
Owned For
Owner Type
Purchase Details
Closed on
Sep 22, 2005
Sold by
Amaya Byron
Bought by
Deleon Mynor
Current Estimated Value
Home Financials for this Owner
Home Financials are based on the most recent Mortgage that was taken out on this home.
Original Mortgage
$7,950
Interest Rate
5.77%
Mortgage Type
Unknown
Purchase Details
Closed on
Jan 24, 2000
Sold by
Amaya Byron
Bought by
Amaya Byron
Home Financials for this Owner
Home Financials are based on the most recent Mortgage that was taken out on this home.
Original Mortgage
$125,345
Interest Rate
8.11%
Mortgage Type
FHA
Purchase Details
Closed on
Jan 21, 2000
Sold by
Barrow Robert G
Bought by
Amaya Byron
Home Financials for this Owner
Home Financials are based on the most recent Mortgage that was taken out on this home.
Original Mortgage
$125,345
Interest Rate
8.11%
Mortgage Type
FHA
Purchase Details
Closed on
Jun 21, 1995
Sold by
Manney Gopichand Arunakum
Bought by
Barrow Robert G
Create a Home Valuation Report for This Property
The Home Valuation Report is an in-depth analysis detailing your home's value as well as a comparison with similar homes in the area
Home Values in the Area
Average Home Value in this Area
Purchase History
| Date | Buyer | Sale Price | Title Company |
|---|---|---|---|
| Deleon Mynor | $159,000 | -- | |
| Amaya Byron | -- | -- | |
| Amaya Byron | $127,000 | -- | |
| Barrow Robert G | $84,300 | -- |
Source: Public Records
Mortgage History
| Date | Status | Borrower | Loan Amount |
|---|---|---|---|
| Closed | Deleon Mynor | $7,950 | |
| Open | Deleon Mynor | $143,100 | |
| Previous Owner | Amaya Byron | $125,345 | |
| Closed | Barrow Robert G | $0 |
Source: Public Records
Tax History Compared to Growth
Tax History
| Year | Tax Paid | Tax Assessment Tax Assessment Total Assessment is a certain percentage of the fair market value that is determined by local assessors to be the total taxable value of land and additions on the property. | Land | Improvement |
|---|---|---|---|---|
| 2025 | $6,701 | $178,600 | $25,840 | $152,760 |
| 2024 | $5,906 | $154,080 | $25,600 | $128,480 |
| 2023 | $5,906 | $154,080 | $25,600 | $128,480 |
| 2022 | $5,429 | $141,640 | $23,200 | $118,440 |
| 2021 | $3,980 | $99,280 | $18,400 | $80,880 |
| 2020 | $3,883 | $96,000 | $16,000 | $80,000 |
| 2019 | $3,744 | $96,000 | $16,000 | $80,000 |
| 2018 | $3,035 | $75,680 | $13,600 | $62,080 |
| 2016 | $2,625 | $63,480 | $11,200 | $52,280 |
| 2015 | $2,216 | $51,400 | $8,000 | $43,400 |
| 2014 | -- | $44,320 | $8,000 | $36,320 |
Source: Public Records
Map
Nearby Homes
- 4880 Racquet Ct
- 5045 Racquet Ct
- 2318 Ingram Rd
- 4767 Glenwhite Dr
- 5041 Rockborough Trail Unit 3
- 4787 Greenway Rd
- 4981 Sharp Way
- 4935 Rockborough Trail
- 5065 Rockborough Trail NW
- 2385 Muirfield Way
- 5055 Running Fox Trail
- 5106 Rockborough Trail
- 2621 Bailey Dr
- 2325 E Hill Way NW
- 4786 Masters Ct Unit 4
- 4242 Morrison Lake Trail
- 4781 Valley Ridge Dr
- 4945 Clara Mae Walk
- 2209 Ranch Trail
- 4873 Mustang Dr
- 4861 Mustang Dr Unit 6
- 2211 Ranch Trail
- 2257 Ingram Rd Unit 6
- 2206 Ranch Trail Unit 6
- 2212 Ranch Trail Unit 6
- 0 Mustang Dr Unit 8454495
- 0 Mustang Dr Unit 8172536
- 0 Mustang Dr
- 3 Mustang Dr
- 2200 Ranch Trail Unit 6
- 2215 Ranch Trail Unit 6
- 2263 Ingram Rd
- 2251 Ingram Rd
- 2269 Ingram Rd
- 2224 Ranch Trail
- 2194 Ranch Trail
- 4872 Mustang Dr
- 2223 Ranch Trail