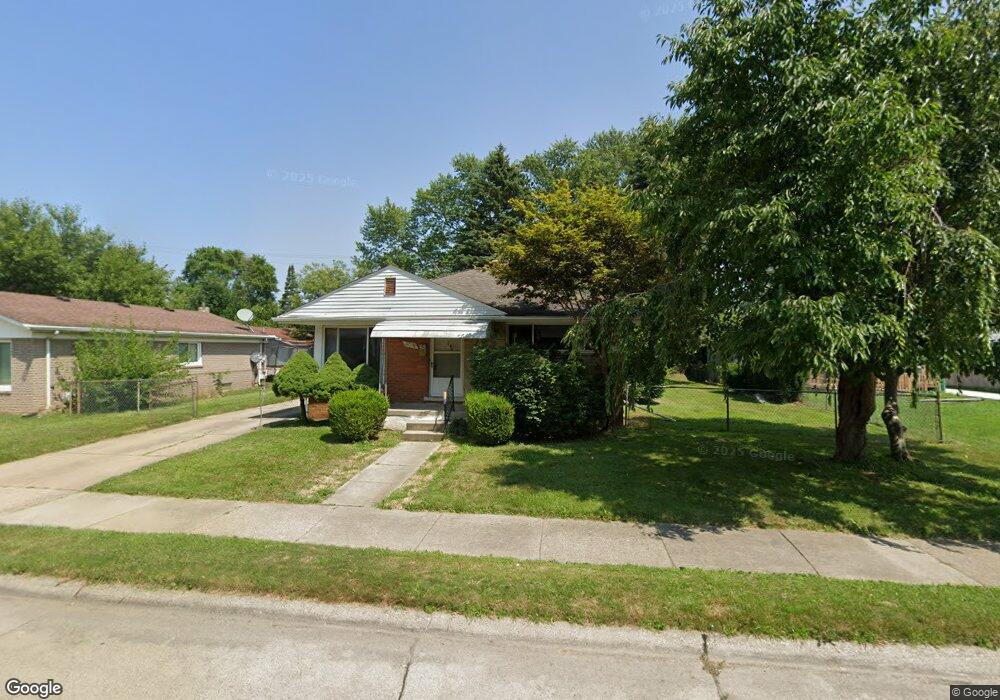
22056 Piper Ave Unit Bldg-Unit Eastpointe, MI 48021
Estimated Value: $103,000 - $121,000
2
Beds
1
Bath
742
Sq Ft
$151/Sq Ft
Est. Value
About This Home
This home is located at 22056 Piper Ave Unit Bldg-Unit, Eastpointe, MI 48021 and is currently estimated at $111,944, approximately $150 per square foot. 22056 Piper Ave Unit Bldg-Unit is a home located in Macomb County with nearby schools including Pleasantview Elementary School, Eastpointe Middle School, and Chandler Park Academy - Elementary School.
Ownership History
Date
Name
Owned For
Owner Type
Purchase Details
Closed on
Oct 30, 2020
Sold by
Investment Realty Service Llc
Bought by
Belleville Lake Acquisitions Llc
Current Estimated Value
Purchase Details
Closed on
Sep 14, 2020
Sold by
Shahar Borenstein Houses Llc
Bought by
Investment Realty Services Llc
Purchase Details
Closed on
Jun 30, 2013
Sold by
Weisman 2012 Llc
Bought by
Shahar Borenstein Houses Llc
Purchase Details
Closed on
Dec 15, 2012
Sold by
Sb Capital Usa Llc
Bought by
Weisman 2012 Llc
Purchase Details
Closed on
Sep 13, 2012
Sold by
Fannie Mae
Bought by
Sb Capital Usa Llc
Purchase Details
Closed on
Dec 1, 2011
Sold by
Aulwes Chris
Bought by
Federal National Mortgage Association
Purchase Details
Closed on
Apr 23, 1999
Sold by
Mauro Joseph C
Bought by
Aulwes Chris
Create a Home Valuation Report for This Property
The Home Valuation Report is an in-depth analysis detailing your home's value as well as a comparison with similar homes in the area
Home Values in the Area
Average Home Value in this Area
Purchase History
| Date | Buyer | Sale Price | Title Company |
|---|---|---|---|
| Belleville Lake Acquisitions Llc | $232,913 | Fidelity National Title | |
| Investment Realty Services Llc | $70,000 | None Available | |
| Investment Realty Services Llc | $70,000 | None Listed On Document | |
| Shahar Borenstein Houses Llc | $49,400 | Stg | |
| Weisman 2012 Llc | $50,100 | None Available | |
| Sb Capital Usa Llc | $2,300,000 | E Title Agency Inc | |
| Federal National Mortgage Association | $84,519 | None Available | |
| Aulwes Chris | $75,000 | -- |
Source: Public Records
Tax History Compared to Growth
Tax History
| Year | Tax Paid | Tax Assessment Tax Assessment Total Assessment is a certain percentage of the fair market value that is determined by local assessors to be the total taxable value of land and additions on the property. | Land | Improvement |
|---|---|---|---|---|
| 2025 | $3,188 | $54,300 | $0 | $0 |
| 2024 | $3,047 | $51,600 | $0 | $0 |
| 2023 | $2,959 | $46,100 | $0 | $0 |
| 2022 | $3,006 | $39,600 | $0 | $0 |
| 2021 | $2,958 | $35,300 | $0 | $0 |
| 2020 | $1,785 | $32,900 | $0 | $0 |
| 2019 | $1,775 | $30,900 | $0 | $0 |
| 2018 | $1,687 | $25,900 | $0 | $0 |
| 2017 | $1,699 | $22,610 | $5,000 | $17,610 |
| 2016 | $1,689 | $22,610 | $0 | $0 |
| 2015 | $1,321 | $20,610 | $0 | $0 |
| 2013 | $1,486 | $20,340 | $0 | $0 |
Source: Public Records
Map
Nearby Homes
- 22056 Piper Ave
- 22036 Piper Ave
- 22071 Donald Ave
- 21819 Rein Ave
- 21833 Cushing Ave
- 21829 Shakespeare Ave
- 21826 Cushing Ave
- 21801 Shakespeare Ave
- 22436 Cushing Ave
- 21753 Piper Ave
- 22114 Pleasant Ave
- 22505 Rein Ave
- 21739 Rein Ave
- 22511 Piper Ave
- 22148 Rausch Ave
- 22113 Pleasant Ave
- 22143 Pleasant Ave
- 22133 David Ave
- 21857 Pleasant Ave
- 16533 Toepfer Dr
- 22068 Piper Ave
- 22044 Piper Ave
- 22043 Rein Ave
- 22059 Rein Ave
- 22076 Piper Ave
- 22067 Rein Ave
- 22028 Piper Ave
- 22084 Piper Ave
- 22029 Rein Ave
- 22075 Rein Ave
- 22083 Rein Ave
- 22020 Piper Ave
- 22061 Piper Ave
- 22045 Piper Ave
- 22069 Piper Ave
- 22037 Piper Ave
- 22021 Rein Ave Unit Bldg-Unit
- 22021 Rein Ave
- 22091 Rein Ave
- 22012 Piper Ave