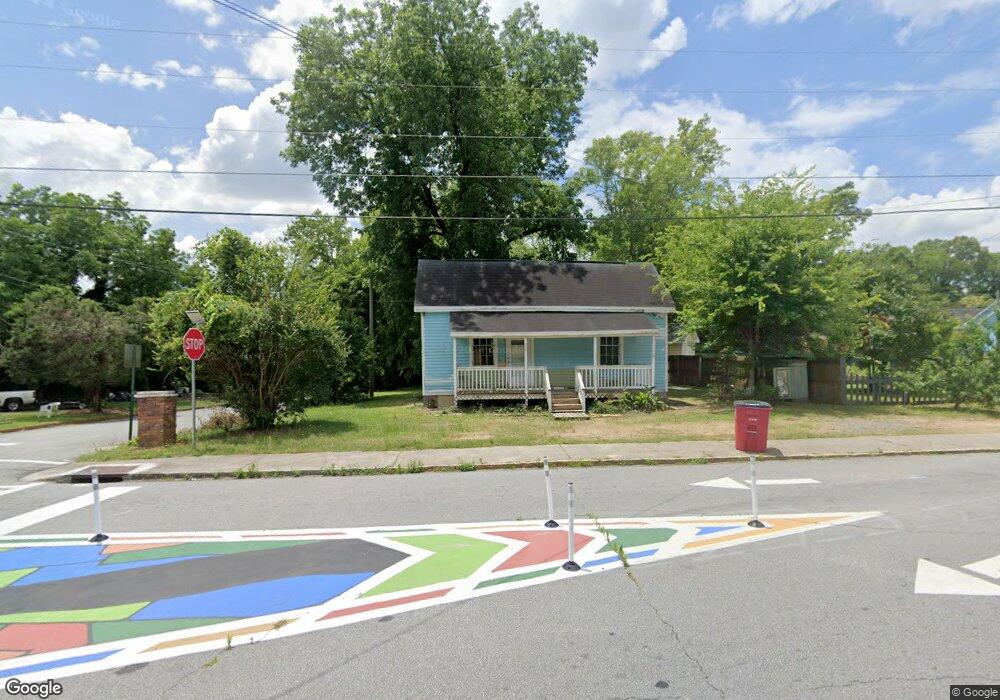
2206 Clayton St Macon, GA 31204
Pleasant Hill Historic District NeighborhoodEstimated Value: $48,529 - $140,000
2
Beds
1
Bath
752
Sq Ft
$121/Sq Ft
Est. Value
About This Home
This home is located at 2206 Clayton St, Macon, GA 31204 and is currently estimated at $90,632, approximately $120 per square foot. 2206 Clayton St is a home located in Bibb County with nearby schools including Williams Elementary School, Miller Fine Arts Magnet Middle School, and Central High School.
Ownership History
Date
Name
Owned For
Owner Type
Purchase Details
Closed on
Jan 28, 2025
Sold by
Pleasant Hill Housing Llc
Bought by
Cross Roads Recovery Ministries Inc
Current Estimated Value
Purchase Details
Closed on
Nov 25, 2014
Sold by
Younis Lawrence and Younis Vivian
Bought by
Pleasant Hill Housing Llc
Purchase Details
Closed on
Jun 3, 2008
Sold by
Younis Vivian and Younis Lawrence D
Bought by
Shine Alphonso
Create a Home Valuation Report for This Property
The Home Valuation Report is an in-depth analysis detailing your home's value as well as a comparison with similar homes in the area
Home Values in the Area
Average Home Value in this Area
Purchase History
| Date | Buyer | Sale Price | Title Company |
|---|---|---|---|
| Cross Roads Recovery Ministries Inc | -- | None Listed On Document | |
| Cross Roads Recovery Ministries Inc | -- | None Listed On Document | |
| Pleasant Hill Housing Llc | $5,000 | None Available | |
| Younis Lawrence | -- | None Available | |
| Shine Alphonso | $7,000 | None Available |
Source: Public Records
Tax History Compared to Growth
Tax History
| Year | Tax Paid | Tax Assessment Tax Assessment Total Assessment is a certain percentage of the fair market value that is determined by local assessors to be the total taxable value of land and additions on the property. | Land | Improvement |
|---|---|---|---|---|
| 2025 | $192 | $7,812 | $1,620 | $6,192 |
| 2024 | $182 | $7,149 | $1,080 | $6,069 |
| 2023 | $172 | $6,783 | $900 | $5,883 |
| 2022 | $166 | $4,790 | $942 | $3,848 |
| 2021 | $182 | $4,790 | $942 | $3,848 |
| 2020 | $186 | $4,790 | $942 | $3,848 |
| 2019 | $221 | $5,634 | $1,108 | $4,526 |
| 2018 | $518 | $5,634 | $1,108 | $4,526 |
| 2017 | $211 | $5,634 | $1,108 | $4,526 |
| 2016 | $195 | $5,634 | $1,108 | $4,526 |
| 2015 | $98 | $5,634 | $1,108 | $4,526 |
| 2014 | $315 | $5,601 | $1,108 | $4,493 |
Source: Public Records
Map
Nearby Homes