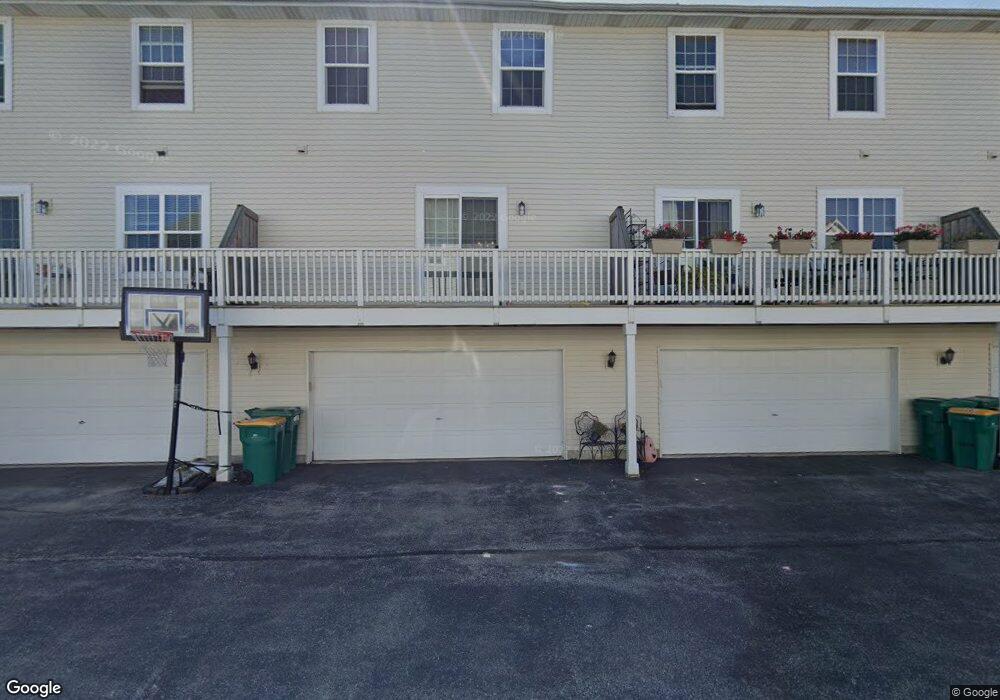
2206 Concord Dr Sycamore, IL 60178
Estimated Value: $209,000 - $235,000
2
Beds
7
Baths
2,132
Sq Ft
$103/Sq Ft
Est. Value
About This Home
This home is located at 2206 Concord Dr, Sycamore, IL 60178 and is currently estimated at $219,071, approximately $102 per square foot. 2206 Concord Dr is a home located in DeKalb County with nearby schools including Sycamore High School, St Mary's Catholic School, and Cornerstone Christian Academy.
Ownership History
Date
Name
Owned For
Owner Type
Purchase Details
Closed on
Feb 16, 2022
Sold by
Tt Vilet Childrens Trust
Bought by
V Family Homes Llc
Current Estimated Value
Purchase Details
Closed on
Mar 18, 2016
Sold by
Weilbaker Jason and Weilbaker Rebecca R
Bought by
Vilet Trust
Purchase Details
Closed on
Dec 26, 2012
Sold by
Weilbaker Rebecca R
Bought by
Weilbaker Jason and Weilbaker Rebecca R
Home Financials for this Owner
Home Financials are based on the most recent Mortgage that was taken out on this home.
Original Mortgage
$145,000
Interest Rate
3.34%
Mortgage Type
New Conventional
Purchase Details
Closed on
Mar 19, 2008
Sold by
Camden Crossing Llc
Bought by
Doty Rebecca R
Home Financials for this Owner
Home Financials are based on the most recent Mortgage that was taken out on this home.
Original Mortgage
$153,900
Interest Rate
6.1%
Mortgage Type
New Conventional
Create a Home Valuation Report for This Property
The Home Valuation Report is an in-depth analysis detailing your home's value as well as a comparison with similar homes in the area
Home Values in the Area
Average Home Value in this Area
Purchase History
| Date | Buyer | Sale Price | Title Company |
|---|---|---|---|
| V Family Homes Llc | -- | Doherty Law Firm Llc | |
| Vilet Trust | $125,000 | -- | |
| Weilbaker Jason | -- | -- | |
| Doty Rebecca R | $179,000 | -- |
Source: Public Records
Mortgage History
| Date | Status | Borrower | Loan Amount |
|---|---|---|---|
| Previous Owner | Weilbaker Jason | $145,000 | |
| Previous Owner | Doty Rebecca R | $153,900 |
Source: Public Records
Tax History Compared to Growth
Tax History
| Year | Tax Paid | Tax Assessment Tax Assessment Total Assessment is a certain percentage of the fair market value that is determined by local assessors to be the total taxable value of land and additions on the property. | Land | Improvement |
|---|---|---|---|---|
| 2024 | $5,048 | $61,103 | $15,143 | $45,960 |
| 2023 | $5,048 | $55,797 | $13,828 | $41,969 |
| 2022 | $4,850 | $51,176 | $12,683 | $38,493 |
| 2021 | $4,635 | $48,044 | $11,907 | $36,137 |
| 2020 | $4,579 | $46,863 | $11,614 | $35,249 |
| 2019 | $4,511 | $45,837 | $11,360 | $34,477 |
| 2018 | $4,444 | $44,446 | $11,015 | $33,431 |
| 2017 | $4,348 | $42,687 | $10,579 | $32,108 |
| 2016 | $4,259 | $40,739 | $10,096 | $30,643 |
| 2015 | -- | $38,342 | $9,502 | $28,840 |
| 2014 | -- | $36,409 | $9,023 | $27,386 |
| 2013 | -- | $37,107 | $9,196 | $27,911 |
Source: Public Records
Map
Nearby Homes
- 2 Bedroom/Sunroom Plan at Camden Crossing
- 2 Bedroom Plan at Camden Crossing
- 1 Bedroom Plan at Camden Crossing
- 2203 Wickford Ln
- 169 Plank Rd
- 224 Whittemore Dr
- 218 Whittemore Dr
- 209 Whittemore Dr
- 233 Whittemore Dr
- 318 Davis Dr
- 326 Davis Dr
- Lot 86 Merry Oaks Dr
- Lot 97 Merry Oaks Dr
- 361 Merry Oaks Dr
- 223 Merry Oaks Dr
- 516 Clayton Cir
- 540 Clayton Cir
- 561 Stonegate Dr Unit 10B1
- 513 Amherst Dr
- Cypress Plan at North Grove Crossings
- 2204 Concord Dr
- 2208 Concord Dr
- 2202 Concord Dr
- 2210 Concord Dr
- 2214 Concord Dr
- 2214 Concord Dr Unit A
- 2216 Concord Dr
- 2218 Concord Dr
- 2220 Concord Dr
- 2200 Concord Dr
- 2222 Concord Dr
- 2224 Concord Dr
- 2207 Concord Dr
- 222 Millbridge Dr Unit 222
- 202 Millbridge Dr
- 206 Millbridge Dr Unit 206
- 220 Millbridge Dr
- 2234 Concord Dr
- 226 Millbridge Dr Unit 226
- 2256 Concord Dr