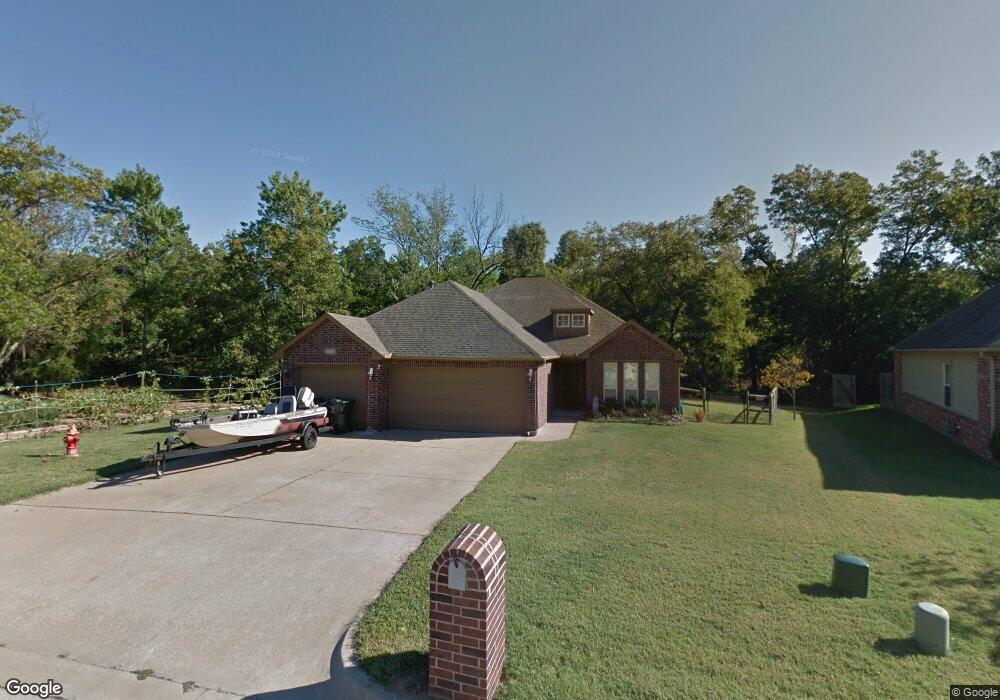
2206 Pecan Chase Cir Claremore, OK 74017
Estimated Value: $266,000 - $282,000
3
Beds
2
Baths
1,868
Sq Ft
$146/Sq Ft
Est. Value
About This Home
This home is located at 2206 Pecan Chase Cir, Claremore, OK 74017 and is currently estimated at $273,201, approximately $146 per square foot. 2206 Pecan Chase Cir is a home located in Rogers County with nearby schools including Westside Elementary School, Will Rogers Junior High School, and Claremore High School.
Ownership History
Date
Name
Owned For
Owner Type
Purchase Details
Closed on
Mar 16, 2010
Sold by
Mueller Matthew J and Mueller Rachel
Bought by
Campbell James G and Campbell Kayla G
Current Estimated Value
Home Financials for this Owner
Home Financials are based on the most recent Mortgage that was taken out on this home.
Original Mortgage
$156,120
Outstanding Balance
$103,014
Interest Rate
4.97%
Mortgage Type
FHA
Estimated Equity
$170,187
Purchase Details
Closed on
Mar 2, 2006
Sold by
Cashmere Builders Inc
Bought by
Mueller Matthew J and Mueller Rachel
Home Financials for this Owner
Home Financials are based on the most recent Mortgage that was taken out on this home.
Original Mortgage
$29,900
Interest Rate
6.05%
Mortgage Type
Seller Take Back
Purchase Details
Closed on
Aug 18, 2003
Sold by
Battlecreek Land Deve Inc
Create a Home Valuation Report for This Property
The Home Valuation Report is an in-depth analysis detailing your home's value as well as a comparison with similar homes in the area
Home Values in the Area
Average Home Value in this Area
Purchase History
| Date | Buyer | Sale Price | Title Company |
|---|---|---|---|
| Campbell James G | $159,000 | None Available | |
| Mueller Matthew J | $150,000 | First American Title & Abst | |
| -- | $17,500 | -- |
Source: Public Records
Mortgage History
| Date | Status | Borrower | Loan Amount |
|---|---|---|---|
| Open | Campbell James G | $156,120 | |
| Previous Owner | Mueller Matthew J | $29,900 |
Source: Public Records
Tax History Compared to Growth
Tax History
| Year | Tax Paid | Tax Assessment Tax Assessment Total Assessment is a certain percentage of the fair market value that is determined by local assessors to be the total taxable value of land and additions on the property. | Land | Improvement |
|---|---|---|---|---|
| 2025 | $1,813 | $20,615 | $3,076 | $17,539 |
| 2024 | $1,757 | $20,014 | $2,986 | $17,028 |
| 2023 | $1,757 | $19,431 | $2,738 | $16,693 |
| 2022 | $1,654 | $18,865 | $2,640 | $16,225 |
| 2021 | $1,529 | $18,316 | $2,640 | $15,676 |
| 2020 | $1,559 | $18,392 | $2,640 | $15,752 |
| 2019 | $1,528 | $17,497 | $2,640 | $14,857 |
| 2018 | $1,568 | $17,972 | $2,640 | $15,332 |
| 2017 | $1,545 | $17,824 | $2,640 | $15,184 |
| 2016 | $1,675 | $18,846 | $2,640 | $16,206 |
| 2015 | $1,604 | $18,297 | $2,640 | $15,657 |
| 2014 | $1,578 | $18,022 | $2,640 | $15,382 |
Source: Public Records
Map
Nearby Homes
- 2207 Pecan Chase Cir
- 2404 S Maywood Dr
- 602 Rosewood Ct
- 612 Westwood Dr
- 2701 Ridgeview Place
- 1420 W Haskell St
- 1230 W Dupont St
- 1206 W Haskell St
- 205 N Kates Ave
- 1410 W Danny St
- 2925 W Berwick
- 751 Christmas Ln
- 511 Glencoe Cir
- 208 N Chambers Trail
- 3011 W Berwick St
- 3103 Callaway Dr
- 2925 Holly Rd
- 3203 Callaway Dr
- 2925 W Holly Hwy 20 Rd
- 1906 Memorial Dr
- 2204 Pecan Chase Cir
- 2208 Pecan Chase Cir
- 2210 Pecan Chase Cir
- 2202 Pecan Chase Cir
- 2203 Pecan Chase Cir
- 2036 W 4th Place S
- 2034 W 4th Place S
- 2209 Pecan Chase Cir
- 2211 Pecan Chase Cir
- 0 Pecan Chase Cir
- 2205 Pecan Chase Cir
- 2200 Pecan Chase Cir
- 2201 Pecan Chase Cir
- 2212 Pecan Chase Cir
- 2032 W 4th Place S
- 2030 W 4th Place S
- 2208 W Driftwood Dr
- 2028 W 4th Place S
- 2121 W Driftwood Dr
- 2121 W Driftwood Dr Unit A