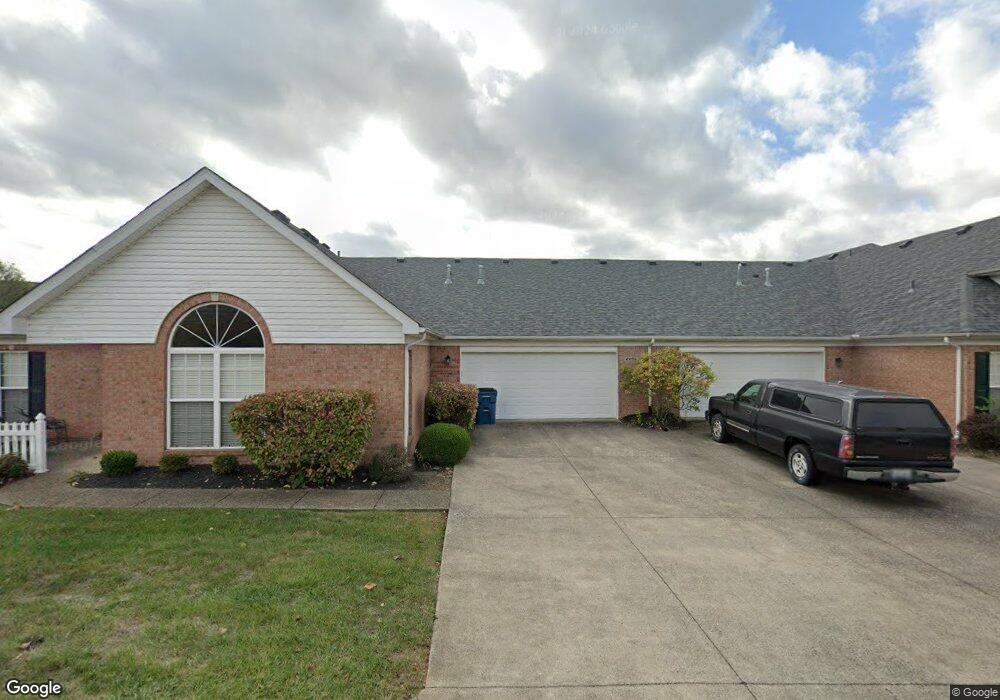
2206 Sugarmaple Dr La Grange, KY 40031
Estimated Value: $261,750 - $280,000
--
Bed
--
Bath
--
Sq Ft
--
Built
About This Home
This home is located at 2206 Sugarmaple Dr, La Grange, KY 40031 and is currently estimated at $270,438. 2206 Sugarmaple Dr is a home located in Oldham County with nearby schools including LaGrange Elementary School, Oldham County Middle School, and Oldham County High School.
Ownership History
Date
Name
Owned For
Owner Type
Purchase Details
Closed on
Dec 13, 2012
Sold by
Howard Gregory A and Howard Shirley
Bought by
Fomby Sue C
Current Estimated Value
Home Financials for this Owner
Home Financials are based on the most recent Mortgage that was taken out on this home.
Original Mortgage
$110,800
Outstanding Balance
$77,019
Interest Rate
3.44%
Mortgage Type
New Conventional
Estimated Equity
$193,419
Purchase Details
Closed on
Mar 15, 2012
Sold by
Cesler Richard Paul and Cesler Paula Jean
Bought by
Howard Gregory A
Home Financials for this Owner
Home Financials are based on the most recent Mortgage that was taken out on this home.
Original Mortgage
$100,000
Interest Rate
3.9%
Mortgage Type
New Conventional
Purchase Details
Closed on
Mar 20, 2006
Sold by
Monsour Springhouse Estates Llc
Bought by
Cesler Richard Paul and Cesler Paula Jean
Home Financials for this Owner
Home Financials are based on the most recent Mortgage that was taken out on this home.
Original Mortgage
$32,100
Interest Rate
6.25%
Mortgage Type
Stand Alone Second
Create a Home Valuation Report for This Property
The Home Valuation Report is an in-depth analysis detailing your home's value as well as a comparison with similar homes in the area
Home Values in the Area
Average Home Value in this Area
Purchase History
| Date | Buyer | Sale Price | Title Company |
|---|---|---|---|
| Fomby Sue C | $138,500 | Metro Title Llc | |
| Howard Gregory A | $143,500 | None Available | |
| Cesler Richard Paul | $160,900 | Multiple |
Source: Public Records
Mortgage History
| Date | Status | Borrower | Loan Amount |
|---|---|---|---|
| Open | Fomby Sue C | $110,800 | |
| Previous Owner | Howard Gregory A | $100,000 | |
| Previous Owner | Cesler Richard Paul | $32,100 | |
| Previous Owner | Cesler Richard Paul | $128,700 |
Source: Public Records
Tax History Compared to Growth
Tax History
| Year | Tax Paid | Tax Assessment Tax Assessment Total Assessment is a certain percentage of the fair market value that is determined by local assessors to be the total taxable value of land and additions on the property. | Land | Improvement |
|---|---|---|---|---|
| 2024 | $2,194 | $220,000 | $0 | $220,000 |
| 2023 | $1,708 | $180,000 | $0 | $180,000 |
| 2022 | $1,765 | $180,000 | $0 | $180,000 |
| 2021 | $1,754 | $180,000 | $0 | $180,000 |
| 2020 | $1,260 | $138,500 | $0 | $138,500 |
| 2019 | $1,248 | $138,500 | $0 | $138,500 |
| 2018 | $1,270 | $138,500 | $0 | $0 |
| 2017 | $1,261 | $138,500 | $0 | $0 |
| 2013 | $1,812 | $138,500 | $0 | $138,500 |
Source: Public Records
Map
Nearby Homes
- 2105 Sugarmaple Dr
- 125 Azalea Ct
- 105 Azalea Ct
- 119 Mcmakin Manor
- 102 Sunset Dr
- 108 Woodlawn Ave
- 919 Artisan Pkwy
- 105 Anchor Ave
- 7020 Black Cherry Ct
- 5003 Aiken Back Ln
- 636 W Madison St
- 526 Wood Lake Dr
- 812 Rosemary Ln
- 2101 Spencer Ct
- 403 Horton Rd
- 809 Rosemary Ln
- 2100 Allen Ln
- Tract 5 Clifford Ln
- 6 Clifford Ln
- 7 Clifford Ln
- 1000 Indigo Place
- 2208 Sugarmaple Dr
- 1002 Indigo Plc
- 1002 Indigo Place
- 1000 Persimmon Place
- 1000 Persimmon Place Unit 1224
- 2210 Sugarmaple Dr
- 2210 Sugarmaple Dr Unit 1
- 2210 Sugarmaple Dr Unit 1312
- 2203 Sugarmaple Dr Unit 1214
- 1004 Indigo Place
- 1004 Indigo Plc Unit 1311
- 1001 White Pine Place Unit 1000
- 1001 Persimmon Place
- 1003 Indigo Place
- 1002 Persimmon Place
- 1073 Rosewood Place
- 1082 Rosewood Place Unit 1082
- 1003 White Pine Place