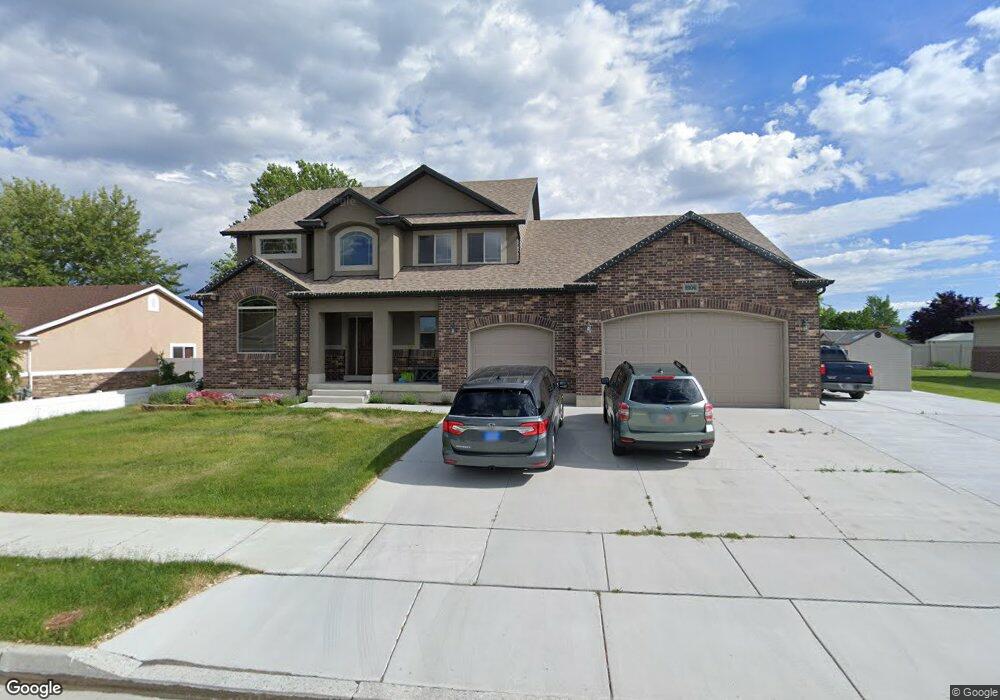
2206 W 470 N West Point, UT 84015
Estimated Value: $695,000 - $784,000
4
Beds
3
Baths
3,881
Sq Ft
$187/Sq Ft
Est. Value
About This Home
This home is located at 2206 W 470 N, West Point, UT 84015 and is currently estimated at $726,611, approximately $187 per square foot. 2206 W 470 N is a home located in Davis County with nearby schools including Lakeside School, West Point Junior High School, and Syracuse High School.
Ownership History
Date
Name
Owned For
Owner Type
Purchase Details
Closed on
Jul 16, 2020
Sold by
Meyer Alicia L and Meyer Chad W
Bought by
Meyer Alicia and Meyer Chad
Current Estimated Value
Home Financials for this Owner
Home Financials are based on the most recent Mortgage that was taken out on this home.
Original Mortgage
$315,459
Outstanding Balance
$279,104
Interest Rate
3.1%
Mortgage Type
VA
Estimated Equity
$447,507
Purchase Details
Closed on
Jun 27, 2017
Sold by
Kingston Merlin E
Bought by
Meyer Alicia I and Meyer Chad W
Home Financials for this Owner
Home Financials are based on the most recent Mortgage that was taken out on this home.
Original Mortgage
$324,000
Interest Rate
4.02%
Mortgage Type
VA
Purchase Details
Closed on
Aug 12, 2016
Sold by
Kingston Merlin E
Bought by
Kingston Merlin
Purchase Details
Closed on
Feb 25, 2013
Sold by
Nd Development Llc
Bought by
Castle Creek Homes Llc
Create a Home Valuation Report for This Property
The Home Valuation Report is an in-depth analysis detailing your home's value as well as a comparison with similar homes in the area
Home Values in the Area
Average Home Value in this Area
Purchase History
| Date | Buyer | Sale Price | Title Company |
|---|---|---|---|
| Meyer Alicia | -- | Backman Title Service | |
| Meyer Alicia I | -- | Us Title | |
| Kingston Merlin | -- | First American Title | |
| Castle Creek Homes Llc | -- | Backman Title Services Ltd |
Source: Public Records
Mortgage History
| Date | Status | Borrower | Loan Amount |
|---|---|---|---|
| Open | Meyer Alicia | $315,459 | |
| Closed | Meyer Alicia I | $324,000 |
Source: Public Records
Tax History Compared to Growth
Tax History
| Year | Tax Paid | Tax Assessment Tax Assessment Total Assessment is a certain percentage of the fair market value that is determined by local assessors to be the total taxable value of land and additions on the property. | Land | Improvement |
|---|---|---|---|---|
| 2025 | $4,073 | $381,700 | $106,735 | $274,965 |
| 2024 | $3,997 | $376,201 | $96,124 | $280,077 |
| 2023 | $3,742 | $648,000 | $117,965 | $530,035 |
| 2022 | $3,900 | $369,600 | $60,851 | $308,749 |
| 2021 | $3,512 | $498,000 | $97,067 | $400,933 |
| 2020 | $3,095 | $433,000 | $81,179 | $351,821 |
| 2019 | $3,095 | $427,000 | $78,868 | $348,132 |
| 2018 | $2,941 | $400,000 | $79,677 | $320,323 |
| 2016 | $2,723 | $194,865 | $30,793 | $164,072 |
| 2015 | $836 | $55,988 | $55,988 | $0 |
| 2014 | $814 | $55,988 | $55,988 | $0 |
| 2013 | -- | $58,964 | $58,964 | $0 |
Source: Public Records
Map
Nearby Homes
- 2190 W 470 N Unit 3
- 2222 W 470 N Unit 1
- 501 N 2200 W
- 482 N 2200 W
- 2215 W 470 N
- 2240 W 470 N
- 2172 W 470 N
- 2230 W 470 N Unit 17
- 2231 W 470 N
- 517 N 2200 W
- 2189 W 470 N Unit 6
- 2189 W 470 N Unit 1
- 2189 W 470 N
- 516 N 2200 W
- 503 N 2150 W
- 431 N 2200 W Unit 15
- 431 N 2200 W
- 2245 W 470 N
- 2167 W 470 N Unit 5
- 2167 W 470 N