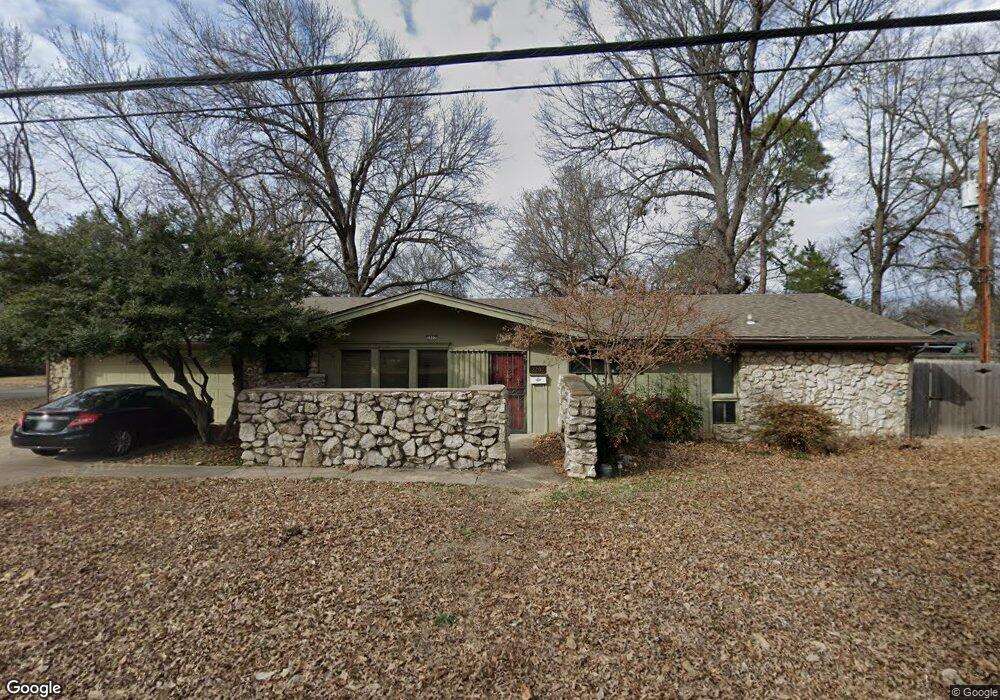
2207 E 55th St Tulsa, OK 74105
South Peoria NeighborhoodEstimated Value: $222,472 - $241,000
3
Beds
2
Baths
1,581
Sq Ft
$147/Sq Ft
Est. Value
About This Home
This home is located at 2207 E 55th St, Tulsa, OK 74105 and is currently estimated at $231,618, approximately $146 per square foot. 2207 E 55th St is a home located in Tulsa County with nearby schools including McClure Elementary School, Memorial Middle School, and Memorial High School.
Ownership History
Date
Name
Owned For
Owner Type
Purchase Details
Closed on
Jan 15, 2021
Sold by
Calderon Rachel A and Calderon Juan Hiraldo
Bought by
Michael Sheri
Current Estimated Value
Home Financials for this Owner
Home Financials are based on the most recent Mortgage that was taken out on this home.
Original Mortgage
$147,283
Outstanding Balance
$130,584
Interest Rate
2.6%
Mortgage Type
FHA
Estimated Equity
$101,034
Purchase Details
Closed on
Feb 28, 2014
Sold by
Calderon Juan A and Calderon Brenda F
Bought by
Calderon Rachel A
Purchase Details
Closed on
Apr 14, 2010
Sold by
Calderon Juan
Bought by
Calderon Rachel A
Purchase Details
Closed on
Jun 1, 2009
Sold by
Federal National Mortgage Association
Bought by
Calderon Juan A
Purchase Details
Closed on
Mar 25, 2009
Sold by
Oliver Don L and Household Finance Corporation
Bought by
Federal National Mortgage Association
Purchase Details
Closed on
Apr 30, 2001
Sold by
Phillips Patricia Hayes and Phillips Robert D
Bought by
Oliver Don
Create a Home Valuation Report for This Property
The Home Valuation Report is an in-depth analysis detailing your home's value as well as a comparison with similar homes in the area
Home Values in the Area
Average Home Value in this Area
Purchase History
| Date | Buyer | Sale Price | Title Company |
|---|---|---|---|
| Michael Sheri | $150,000 | American Eagle Title Group | |
| Calderon Rachel A | -- | None Available | |
| Calderon Rachel A | -- | None Available | |
| Calderon Juan A | -- | Firstitle & Abstract Service | |
| Federal National Mortgage Association | $97,548 | None Available | |
| Oliver Don | $107,000 | Tulsa Abstract & Title Co |
Source: Public Records
Mortgage History
| Date | Status | Borrower | Loan Amount |
|---|---|---|---|
| Open | Michael Sheri | $147,283 |
Source: Public Records
Tax History
| Year | Tax Paid | Tax Assessment Tax Assessment Total Assessment is a certain percentage of the fair market value that is determined by local assessors to be the total taxable value of land and additions on the property. | Land | Improvement |
|---|---|---|---|---|
| 2025 | $2,329 | $17,381 | $2,841 | $14,540 |
| 2024 | $2,199 | $16,845 | $3,102 | $13,743 |
| 2023 | $2,199 | $17,325 | $3,100 | $14,225 |
| 2022 | $2,200 | $16,500 | $3,649 | $12,851 |
| 2021 | $1,592 | $12,051 | $3,064 | $8,987 |
| 2020 | $1,365 | $10,477 | $2,664 | $7,813 |
| 2019 | $1,390 | $10,143 | $2,579 | $7,564 |
| 2018 | $1,348 | $9,818 | $2,496 | $7,322 |
| 2017 | $1,303 | $10,503 | $2,670 | $7,833 |
| 2016 | $1,235 | $10,197 | $2,592 | $7,605 |
| 2015 | $1,197 | $9,900 | $3,311 | $6,589 |
| 2014 | $1,186 | $9,900 | $3,311 | $6,589 |
Source: Public Records
Map
Nearby Homes
- 5405 S Xanthus Ave
- 2202 E 55th Ct Unit 2202`
- 2107 E 52nd Place
- 1909 E 52nd St
- 1737 E 56th St
- 5519 S Atlanta Ave Unit 24
- 1808 E 58th St
- 5606 S Trenton Ave
- 2528 E 57th St
- 5140 S Troost Ave
- 5249 S Saint Louis Ave
- 2130 E 59th St Unit 3
- 2124 E 60th Ct Unit O-4
- 2130 E 60th St Unit I3
- 2112 E 60th St Unit J6
- 1538 E 53rd St
- 4829 S Zunis Ave
- 5127 S Columbia Ave
- 2706 E 57th St
- 6003 S Atlanta Ave Unit 1
- 5429 S Zunis Ave
- 5436 S Zunis Place
- 5430 S Zunis Place
- 5423 S Zunis Ave
- 5436 S Zunis Ave
- 5430 S Zunis Ave
- 2148 E 55th St
- 5424 S Zunis Place
- 2152 E 55th St
- 5417 S Zunis Ave
- 2134 E 55th St
- 5424 S Zunis Ave
- 5418 S Zunis Place
- 5418 S Zunis Ave
- 5411 S Zunis Ave
- 5349 S Yorktown Ave
- 5435 S Zunis Place
- 5341 S Yorktown Ave
- 5429 S Zunis Place
- 5412 S Zunis Place
Your Personal Tour Guide
Ask me questions while you tour the home.