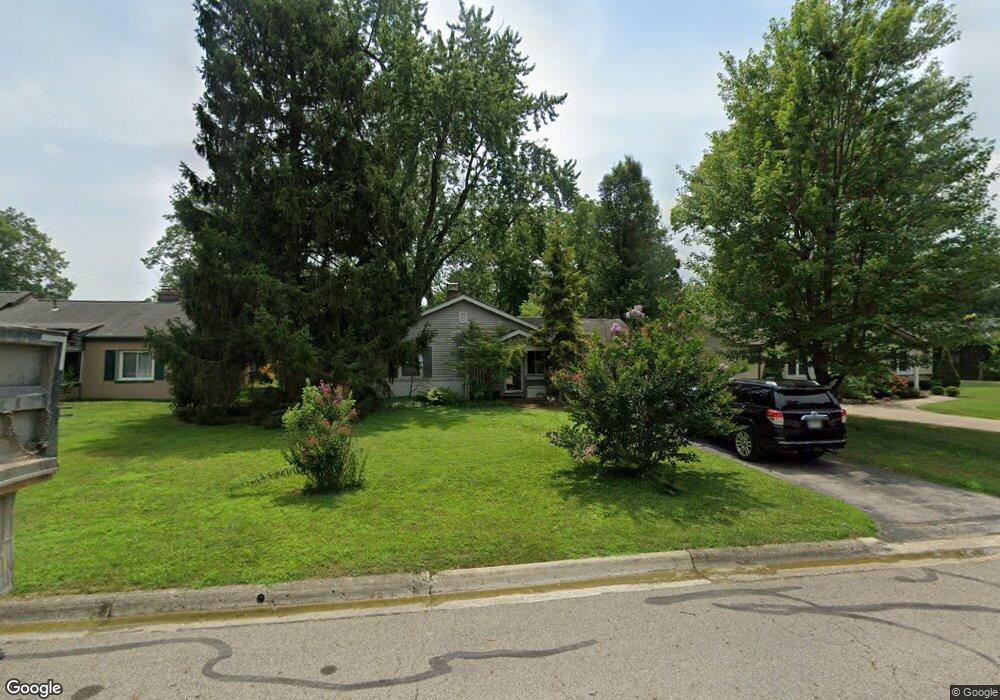
2207 Jervis Rd Columbus, OH 43221
Estimated Value: $277,000 - $1,202,000
2
Beds
1
Bath
812
Sq Ft
$670/Sq Ft
Est. Value
About This Home
This home is located at 2207 Jervis Rd, Columbus, OH 43221 and is currently estimated at $543,695, approximately $669 per square foot. 2207 Jervis Rd is a home located in Franklin County with nearby schools including Tremont Elementary School, Jones Middle School, and Upper Arlington High School.
Ownership History
Date
Name
Owned For
Owner Type
Purchase Details
Closed on
Dec 11, 2003
Sold by
Hud
Bought by
Fisher John K
Current Estimated Value
Home Financials for this Owner
Home Financials are based on the most recent Mortgage that was taken out on this home.
Original Mortgage
$105,450
Outstanding Balance
$47,819
Interest Rate
6.03%
Mortgage Type
Purchase Money Mortgage
Estimated Equity
$495,876
Purchase Details
Closed on
Aug 18, 2003
Sold by
Dietsch Nancy J and Atlantic Mortgage & Investment
Bought by
Hud
Purchase Details
Closed on
Aug 18, 1998
Sold by
Gard Harry K
Bought by
Dietsch Nancy J
Home Financials for this Owner
Home Financials are based on the most recent Mortgage that was taken out on this home.
Original Mortgage
$108,300
Interest Rate
6.99%
Mortgage Type
FHA
Create a Home Valuation Report for This Property
The Home Valuation Report is an in-depth analysis detailing your home's value as well as a comparison with similar homes in the area
Home Values in the Area
Average Home Value in this Area
Purchase History
We collect this data history from publicly available records. To have your information removed, we recommend requesting removal directly through your county’s website.
| Date | Buyer | Sale Price | Title Company |
|---|---|---|---|
| Fisher John K | $105,492 | Lakeside Title & Escrow | |
| Hud | $110,000 | Independent Title | |
| Dietsch Nancy J | $93,000 | Preferred Title Agency Inc |
Source: Public Records
Mortgage History
We collect this data history from publicly available records. To have your information removed, we recommend requesting removal directly through your county’s website.
| Date | Status | Borrower | Loan Amount |
|---|---|---|---|
| Open | Fisher John K | $105,450 | |
| Previous Owner | Dietsch Nancy J | $108,300 |
Source: Public Records
Tax History
| Year | Tax Paid | Tax Assessment Tax Assessment Total Assessment is a certain percentage of the fair market value that is determined by local assessors to be the total taxable value of land and additions on the property. | Land | Improvement |
|---|---|---|---|---|
| 2025 | $5,846 | $93,100 | $45,850 | $47,250 |
| 2024 | $5,846 | $93,100 | $45,850 | $47,250 |
| 2023 | $5,722 | $93,100 | $45,850 | $47,250 |
| 2022 | $5,189 | $69,760 | $33,950 | $35,810 |
| 2021 | $4,748 | $69,760 | $33,950 | $35,810 |
| 2020 | $4,661 | $69,760 | $33,950 | $35,810 |
| 2019 | $4,540 | $60,940 | $33,950 | $26,990 |
| 2018 | $3,930 | $60,940 | $33,950 | $26,990 |
| 2017 | $3,854 | $60,940 | $33,950 | $26,990 |
| 2016 | $3,391 | $49,390 | $26,670 | $22,720 |
| 2015 | $3,361 | $49,390 | $26,670 | $22,720 |
| 2014 | $3,266 | $49,390 | $26,670 | $22,720 |
| 2013 | $1,645 | $44,905 | $24,255 | $20,650 |
Source: Public Records
Map
Nearby Homes
- 2227 Zollinger Rd
- 3131 Redding Rd
- 3186 Mountview Rd
- 3134 Asbury Dr
- 2979 Avalon Rd
- 2350 Zollinger Rd
- 3172 Fisher Place
- 2063 Langham Rd
- 3250 Ainwick Rd
- 3030 Derby Rd
- 2425 Dorset Rd
- 2406 Canterbury Rd
- 1934 Milden Rd
- 2762 Tremont Rd
- 2511 Edington Rd
- 2301 Brixton Rd
- 2268 Shrewsbury Rd
- 2255 Cranford Rd
- 2642 Clifton Rd
- 3175 Tremont Rd Unit 504
- 2215 Jervis Rd
- 2199 Jervis Rd
- 2212 Inchcliff Rd
- 2189 Jervis Rd
- 3084 Mountview Rd
- 2220 Inchcliff Rd
- 2204 Inchcliff Rd
- 2206 Jervis Rd
- 2196 Inchcliff Rd
- 2214 Jervis Rd
- 2230 Inchcliff Rd
- 2198 Jervis Rd
- 2181 Jervis Rd
- 2188 Jervis Rd
- 2222 Jervis Rd
- 2188 Inchcliff Rd
- 2173 Jervis Rd
- 2180 Jervis Rd
- 2180 Inchcliff Rd
- 2213 Inchcliff Rd
Your Personal Tour Guide
Ask me questions while you tour the home.