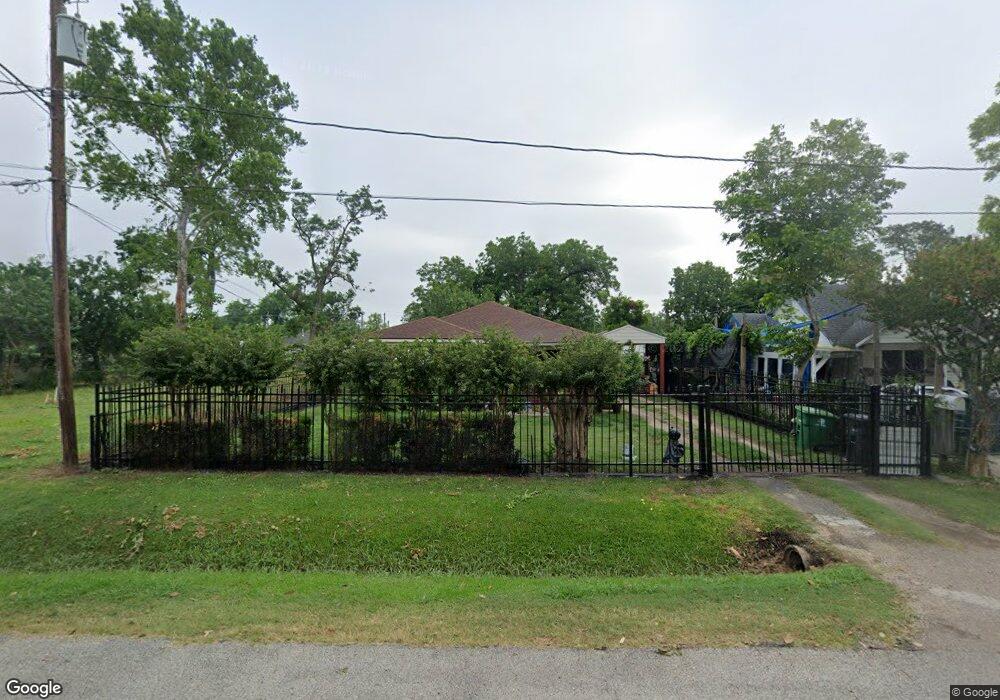
2207 Reid St Houston, TX 77026
Eastex-Jensen NeighborhoodEstimated Value: $185,000 - $234,000
2
Beds
1
Bath
1,114
Sq Ft
$180/Sq Ft
Est. Value
About This Home
This home is located at 2207 Reid St, Houston, TX 77026 and is currently estimated at $200,073, approximately $179 per square foot. 2207 Reid St is a home located in Harris County with nearby schools including Ross Elementary School, Key Middle, and Northside High School.
Ownership History
Date
Name
Owned For
Owner Type
Purchase Details
Closed on
Jul 14, 2023
Sold by
Hancock Luzviminda M
Bought by
Hancock Luzviminda M
Current Estimated Value
Home Financials for this Owner
Home Financials are based on the most recent Mortgage that was taken out on this home.
Original Mortgage
$170,000
Outstanding Balance
$165,854
Interest Rate
6.67%
Mortgage Type
Credit Line Revolving
Estimated Equity
$34,219
Purchase Details
Closed on
Oct 13, 2008
Sold by
Hancock Herman Ray
Bought by
Hancock Herman Ray and Estate Of Othell Flynn Hancock
Create a Home Valuation Report for This Property
The Home Valuation Report is an in-depth analysis detailing your home's value as well as a comparison with similar homes in the area
Home Values in the Area
Average Home Value in this Area
Purchase History
| Date | Buyer | Sale Price | Title Company |
|---|---|---|---|
| Hancock Luzviminda M | -- | None Listed On Document | |
| Hancock Herman Ray | -- | None Available |
Source: Public Records
Mortgage History
| Date | Status | Borrower | Loan Amount |
|---|---|---|---|
| Open | Hancock Luzviminda M | $170,000 |
Source: Public Records
Tax History Compared to Growth
Tax History
| Year | Tax Paid | Tax Assessment Tax Assessment Total Assessment is a certain percentage of the fair market value that is determined by local assessors to be the total taxable value of land and additions on the property. | Land | Improvement |
|---|---|---|---|---|
| 2025 | $236 | $164,407 | $83,025 | $81,382 |
| 2024 | $236 | $176,215 | $91,125 | $85,090 |
| 2023 | $236 | $172,876 | $91,125 | $81,751 |
| 2022 | $1,750 | $138,431 | $60,750 | $77,681 |
| 2021 | $1,684 | $114,468 | $60,750 | $53,718 |
| 2020 | $1,591 | $88,168 | $32,400 | $55,768 |
| 2019 | $1,511 | $88,168 | $32,400 | $55,768 |
| 2018 | $328 | $54,291 | $18,225 | $36,066 |
| 2017 | $1,373 | $54,291 | $18,225 | $36,066 |
| 2016 | $1,373 | $54,291 | $18,225 | $36,066 |
| 2015 | $392 | $49,949 | $16,200 | $33,749 |
| 2014 | $392 | $49,949 | $16,200 | $33,749 |
Source: Public Records
Map
Nearby Homes