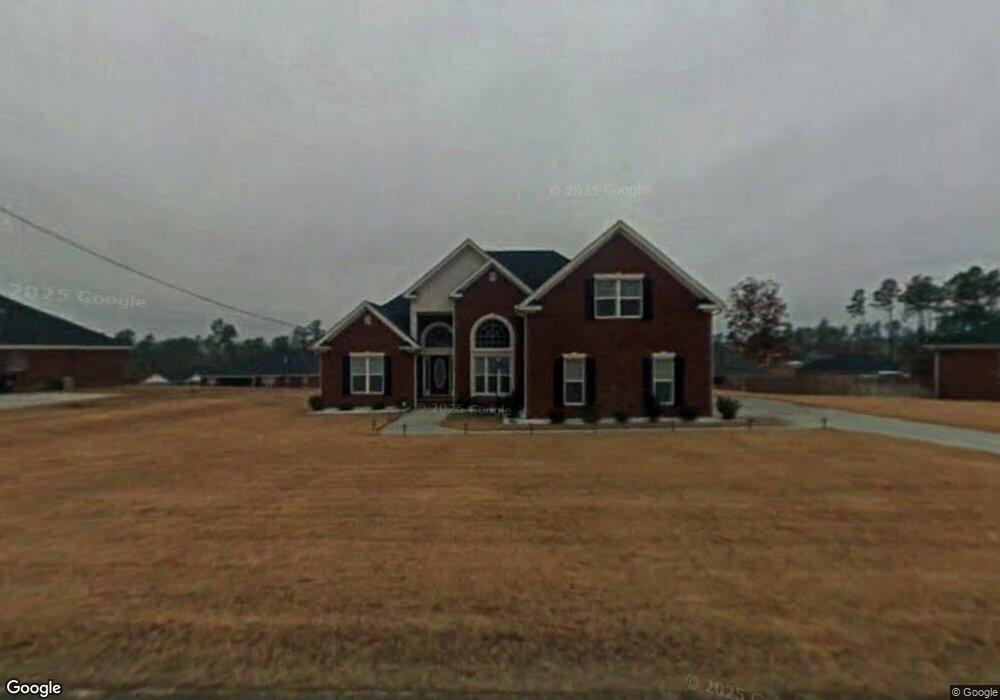
2207 Riley Ct Hephzibah, GA 30815
Jamestown NeighborhoodEstimated Value: $336,848 - $365,000
3
Beds
3
Baths
2,604
Sq Ft
$135/Sq Ft
Est. Value
About This Home
This home is located at 2207 Riley Ct, Hephzibah, GA 30815 and is currently estimated at $351,962, approximately $135 per square foot. 2207 Riley Ct is a home located in Richmond County with nearby schools including Deer Chase Elementary School, Hephzibah Middle School, and Johnson Magnet.
Ownership History
Date
Name
Owned For
Owner Type
Purchase Details
Closed on
Aug 6, 2009
Sold by
Anthony Tyshawn L and Anthony Kwana M
Bought by
Seabrook Tyrone L
Current Estimated Value
Home Financials for this Owner
Home Financials are based on the most recent Mortgage that was taken out on this home.
Original Mortgage
$258,146
Outstanding Balance
$168,054
Interest Rate
5.26%
Mortgage Type
VA
Estimated Equity
$183,908
Purchase Details
Closed on
Nov 8, 2004
Sold by
Kenneth Smith Homebuilders Inc
Bought by
Anthony Tyshawn L and Anthony Kwana M
Home Financials for this Owner
Home Financials are based on the most recent Mortgage that was taken out on this home.
Original Mortgage
$226,411
Interest Rate
5.77%
Mortgage Type
VA
Create a Home Valuation Report for This Property
The Home Valuation Report is an in-depth analysis detailing your home's value as well as a comparison with similar homes in the area
Home Values in the Area
Average Home Value in this Area
Purchase History
| Date | Buyer | Sale Price | Title Company |
|---|---|---|---|
| Seabrook Tyrone L | $249,900 | -- | |
| Anthony Tyshawn L | $221,700 | -- |
Source: Public Records
Mortgage History
| Date | Status | Borrower | Loan Amount |
|---|---|---|---|
| Open | Seabrook Tyrone L | $258,146 | |
| Previous Owner | Anthony Tyshawn L | $226,411 |
Source: Public Records
Tax History Compared to Growth
Tax History
| Year | Tax Paid | Tax Assessment Tax Assessment Total Assessment is a certain percentage of the fair market value that is determined by local assessors to be the total taxable value of land and additions on the property. | Land | Improvement |
|---|---|---|---|---|
| 2025 | $798 | $134,028 | $15,920 | $118,108 |
| 2024 | $798 | $136,096 | $15,920 | $120,176 |
| 2023 | $406 | $113,524 | $15,920 | $97,604 |
| 2022 | $483 | $104,863 | $15,920 | $88,943 |
| 2021 | $396 | $83,017 | $15,920 | $67,097 |
| 2020 | $396 | $83,017 | $15,920 | $67,097 |
| 2019 | $2,920 | $83,017 | $15,920 | $67,097 |
| 2018 | $2,941 | $83,017 | $15,920 | $67,097 |
| 2017 | $2,924 | $83,017 | $15,920 | $67,097 |
| 2016 | $2,926 | $83,017 | $15,920 | $67,097 |
| 2015 | $2,947 | $83,017 | $15,920 | $67,097 |
| 2014 | $3,053 | $81,158 | $15,920 | $65,238 |
Source: Public Records
Map
Nearby Homes
- 1914 Mitchell Place
- 2213 Riley Ct
- 1855 Beaver Creek Ln
- 1610 Jonathan Place
- 1764 Deer Chase Ln
- 1708 Ethan Way
- 2682 Inverness Dr
- 1432 Issac Way
- 2686 Inverness Dr
- 2690 Inverness Dr
- 2613 Inverness Dr
- 2003 Jocelyn Place
- 2525 Hollington Dr
- 2640 Carrington Dr
- 2705 Inverness Dr
- 2524 Hollington Dr
- 2709 Inverness Dr
- 2698 Inverness Dr
- 2520 Hollington Dr
- 4428 T J Kelly Dr
- 2205 Riley Ct
- 2209 Riley Ct
- 1916 Mitchell Place
- 2206 Riley Ct
- 2301 Kim Ct
- 1912 Mitchell Place
- 2211 Riley Ct
- 2203 Riley Ct
- 2208 Riley Ct
- 2302 Kim Ct
- 1910 Mitchell Place
- 1918 Mitchell Place
- 2303 Kim Ct
- 2103 Lisa Ln
- 2201 Riley Ct
- 2304 Kim Ct
- 2210 Riley Ct
- 1915 Mitchell Place
- 1913 Mitchell Place
- 2101 Lisa Ln