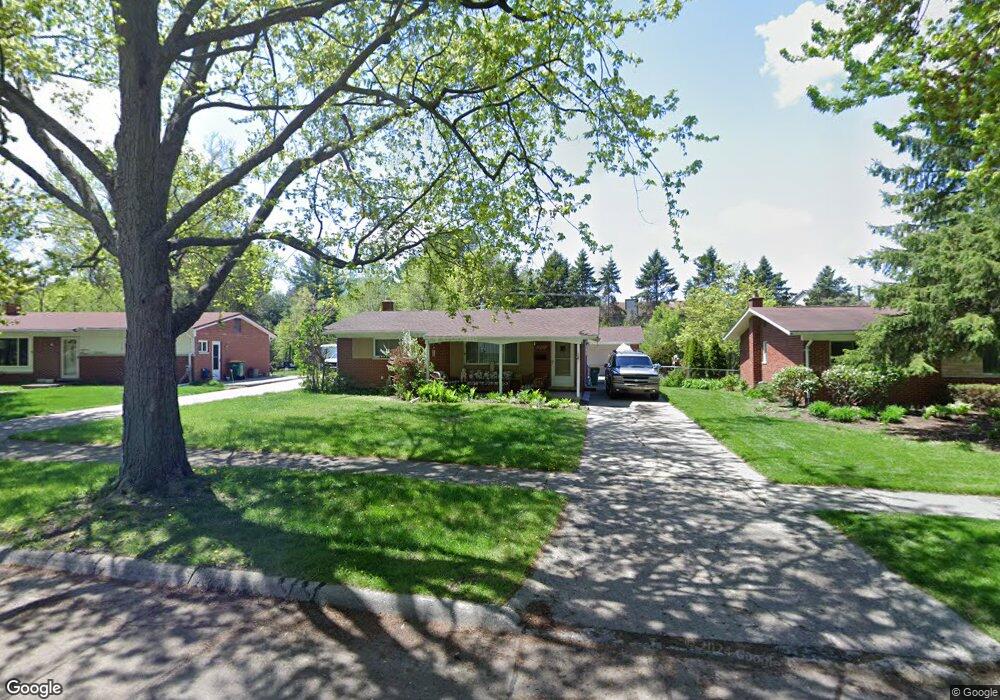
22071 W Brandon St Farmington Hills, MI 48336
Estimated Value: $242,000 - $277,000
3
Beds
1
Bath
1,113
Sq Ft
$234/Sq Ft
Est. Value
About This Home
This home is located at 22071 W Brandon St, Farmington Hills, MI 48336 and is currently estimated at $260,799, approximately $234 per square foot. 22071 W Brandon St is a home located in Oakland County with nearby schools including JA Lanigan Elementary School, East Middle School, and David Ellis Academy West.
Ownership History
Date
Name
Owned For
Owner Type
Purchase Details
Closed on
Nov 29, 2016
Sold by
Dunn Brian C and Dunn Myrna
Bought by
Dunn Brian C and Dunn Myrna
Current Estimated Value
Purchase Details
Closed on
Nov 28, 2006
Sold by
Rong Yue Yuan and Mar Yue Yan
Bought by
Dunn Brian C and Dunn Myrna
Home Financials for this Owner
Home Financials are based on the most recent Mortgage that was taken out on this home.
Original Mortgage
$119,200
Outstanding Balance
$71,897
Interest Rate
6.47%
Mortgage Type
Purchase Money Mortgage
Estimated Equity
$188,902
Purchase Details
Closed on
Jul 10, 2001
Sold by
Mar Wai S
Bought by
Mar Yue Y
Purchase Details
Closed on
May 1, 2000
Sold by
Downey Timothy S
Bought by
Mar Wai S
Home Financials for this Owner
Home Financials are based on the most recent Mortgage that was taken out on this home.
Original Mortgage
$108,896
Interest Rate
8.18%
Mortgage Type
Purchase Money Mortgage
Create a Home Valuation Report for This Property
The Home Valuation Report is an in-depth analysis detailing your home's value as well as a comparison with similar homes in the area
Home Values in the Area
Average Home Value in this Area
Purchase History
| Date | Buyer | Sale Price | Title Company |
|---|---|---|---|
| Dunn Brian C | -- | None Available | |
| Dunn Brian C | $149,000 | Metropolitan Title Company | |
| Mar Yue Y | -- | -- | |
| Mar Wai S | $142,000 | -- |
Source: Public Records
Mortgage History
| Date | Status | Borrower | Loan Amount |
|---|---|---|---|
| Open | Dunn Brian C | $119,200 | |
| Previous Owner | Mar Wai S | $108,896 |
Source: Public Records
Tax History Compared to Growth
Tax History
| Year | Tax Paid | Tax Assessment Tax Assessment Total Assessment is a certain percentage of the fair market value that is determined by local assessors to be the total taxable value of land and additions on the property. | Land | Improvement |
|---|---|---|---|---|
| 2024 | $2,199 | $116,780 | $18,560 | $98,220 |
| 2022 | $2,101 | $95,090 | $14,750 | $80,340 |
| 2021 | $2,615 | $87,860 | $14,750 | $73,110 |
| 2020 | $1,940 | $83,040 | $14,750 | $68,290 |
| 2018 | $2,385 | $74,110 | $0 | $0 |
| 2015 | -- | $56,000 | $0 | $0 |
| 2014 | -- | $46,870 | $0 | $0 |
| 2011 | -- | $52,280 | $0 | $0 |
Source: Public Records
Map
Nearby Homes
- 22148 W Brandon St
- 21526 Oxford Ave
- 22025 Ontaga St
- 21845 Inkster Rd
- 22035 Inkster Rd
- 21431 Oxford Ave
- 21411 Collingham Ave
- 21408 Collingham Ave
- 22051 Seminole St
- 21779 Seminole St
- 22034 Seminole St
- 27333 Arborway Rd Unit 37
- 21345 Inkster Rd
- 21632 Jacksonville St
- 21200 Collingham Ave
- 21731 Jacksonville St
- 21212 Rensselaer St
- 21122 Waldron St
- 21550 Poinciana St
- 21221 Hamilton Ave
- 22079 W Brandon St
- 22063 W Brandon St
- 22087 W Brandon St
- 21924 Arbor Ln
- 22055 W Brandon St
- 21937 Arbor Ln
- 21946 Arbor Ln
- 22095 W Brandon St
- 22064 W Brandon St
- 22076 W Brandon St
- 22047 W Brandon St
- 22084 W Brandon St
- 22042 W Brandon St
- 22103 W Brandon St Unit Bldg-Unit
- 22103 W Brandon St
- 22092 W Brandon St Unit Bldg-Unit
- 22092 W Brandon St
- 21958 Arbor Ln
- 21949 Arbor Ln
- 22039 W Brandon St