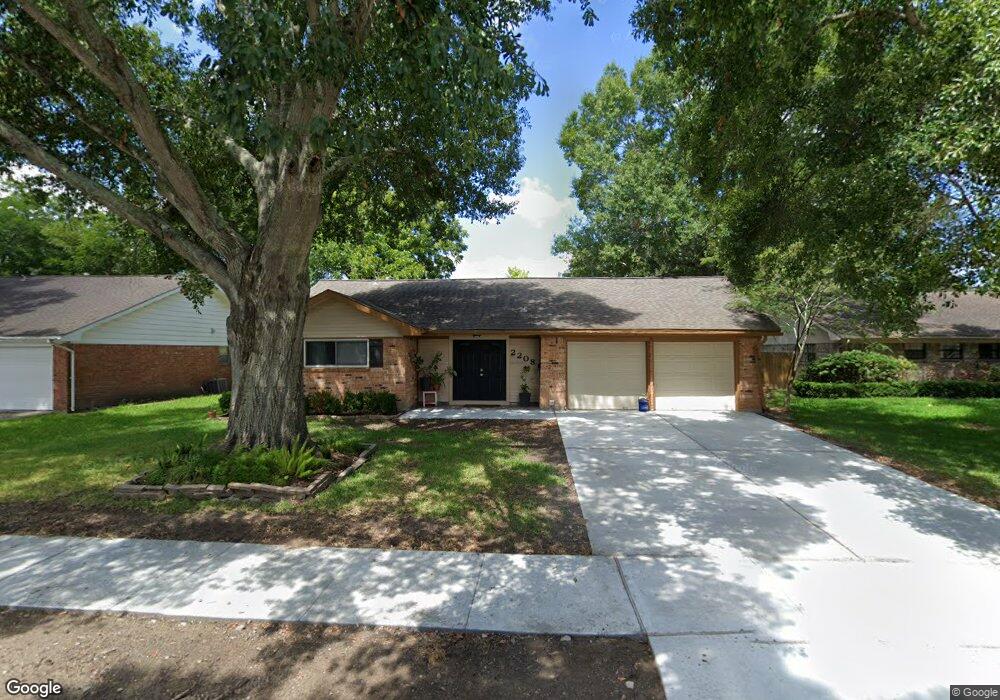
2208 Cedar St Pearland, TX 77581
Estimated Value: $249,000 - $281,000
3
Beds
2
Baths
1,432
Sq Ft
$185/Sq Ft
Est. Value
About This Home
This home is located at 2208 Cedar St, Pearland, TX 77581 and is currently estimated at $264,731, approximately $184 per square foot. 2208 Cedar St is a home located in Brazoria County with nearby schools including Barbara Cockrell Elementary School, Pearland Junior High School West, and Leon H. Sablatura Middle School.
Ownership History
Date
Name
Owned For
Owner Type
Purchase Details
Closed on
Mar 2, 2017
Sold by
Scoreo Llc
Bought by
Rougeau Travis A and Gullory Elizabeth A
Current Estimated Value
Home Financials for this Owner
Home Financials are based on the most recent Mortgage that was taken out on this home.
Original Mortgage
$161,500
Outstanding Balance
$133,999
Interest Rate
4.19%
Mortgage Type
New Conventional
Estimated Equity
$130,732
Purchase Details
Closed on
Dec 7, 2016
Sold by
K Town Homes Llc
Bought by
Scoreo Llc and R Koury Investmetn Llc
Purchase Details
Closed on
Apr 29, 2004
Sold by
Loria Frank Leonard and Loria Carlotta J
Bought by
Hampton Denise
Home Financials for this Owner
Home Financials are based on the most recent Mortgage that was taken out on this home.
Original Mortgage
$86,400
Interest Rate
5.81%
Mortgage Type
Purchase Money Mortgage
Create a Home Valuation Report for This Property
The Home Valuation Report is an in-depth analysis detailing your home's value as well as a comparison with similar homes in the area
Home Values in the Area
Average Home Value in this Area
Purchase History
| Date | Buyer | Sale Price | Title Company |
|---|---|---|---|
| Rougeau Travis A | -- | South Land Title Llc | |
| Rougeau Travis A | -- | South Land Title Llc | |
| Scoreo Llc | -- | Pss Title | |
| K Town Homes Llc | -- | Pss Title | |
| Hampton Denise | -- | First American Title |
Source: Public Records
Mortgage History
| Date | Status | Borrower | Loan Amount |
|---|---|---|---|
| Open | Rougeau Travis A | $161,500 | |
| Closed | Rougeau Travis A | $161,500 | |
| Previous Owner | Hampton Denise | $86,400 | |
| Closed | Hampton Denise | $16,200 |
Source: Public Records
Tax History Compared to Growth
Tax History
| Year | Tax Paid | Tax Assessment Tax Assessment Total Assessment is a certain percentage of the fair market value that is determined by local assessors to be the total taxable value of land and additions on the property. | Land | Improvement |
|---|---|---|---|---|
| 2025 | $3,960 | $238,910 | $29,290 | $209,620 |
| 2023 | $3,960 | $221,931 | $30,460 | $204,010 |
| 2022 | $4,853 | $201,755 | $30,460 | $175,690 |
| 2021 | $4,726 | $195,270 | $30,460 | $164,810 |
| 2020 | $4,499 | $166,740 | $23,430 | $143,310 |
| 2019 | $4,113 | $152,420 | $23,430 | $128,990 |
| 2018 | $4,190 | $155,960 | $23,430 | $132,530 |
| 2017 | $3,601 | $133,370 | $23,430 | $109,940 |
| 2016 | $3,426 | $134,880 | $23,430 | $111,450 |
| 2014 | $2,575 | $106,550 | $23,430 | $83,120 |
Source: Public Records
Map
Nearby Homes
- 2312 Willow Blvd
- 4804 W Plum St
- 2315 Cedar St
- 2317 Cedar St
- 2322 Francis Dr
- 2245 N Austin Ave
- 5208 Cunningham Dr
- 2304 Lynn Dr
- 4610 & 4612 W Orange St
- 2321 Pearland Ave
- 2102 Pearland Ave
- 4615 W Walnut St
- 5013 Camden Ln
- 4901 Shank Rd
- 4609 Buescher Ct
- 5602 Megan St
- 6420 Tindarey Creek Ln
- 17828 S Highway 35
- 5205 Carmona Ln
- 2721 Village Mills Dr
- 2206 Cedar St
- 2207 Willow Blvd
- 2209 Willow Blvd
- 2205 Willow Blvd
- 2212 Cedar St
- 2204 Cedar St
- 2211 Willow Blvd
- 2203 Willow Blvd
- 2207 Cedar St
- 2205 Cedar St
- 2209 Cedar St
- 2214 Cedar St
- 2202 Cedar St
- 2211 Cedar St
- 2203 Cedar St
- 2213 Willow Blvd
- 2201 Willow Blvd
- 2216 Cedar St
- 2213 Cedar St
- 2201 Cedar St