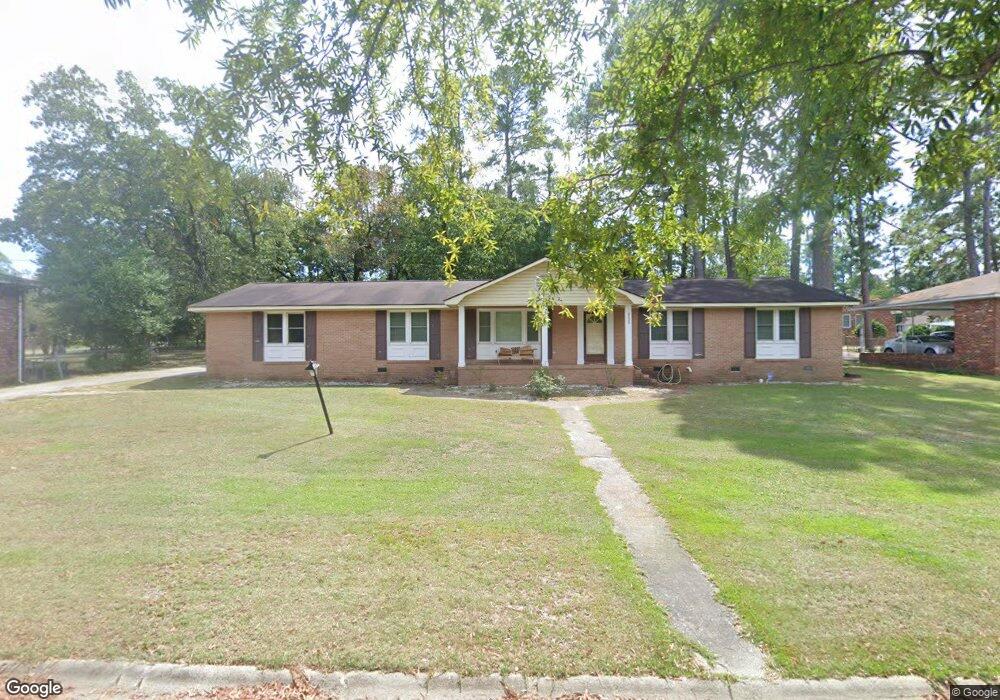
2208 Dunvegan Dr Columbia, SC 29209
Southeast Columbia NeighborhoodEstimated Value: $216,000 - $233,312
3
Beds
2
Baths
1,992
Sq Ft
$113/Sq Ft
Est. Value
About This Home
This home is located at 2208 Dunvegan Dr, Columbia, SC 29209 and is currently estimated at $225,578, approximately $113 per square foot. 2208 Dunvegan Dr is a home located in Richland County with nearby schools including Caughman Road Elementary School, Hopkins Middle School, and Lower Richland High School.
Ownership History
Date
Name
Owned For
Owner Type
Purchase Details
Closed on
Mar 29, 2019
Sold by
Whidden Richard T
Bought by
Collins Shaneta
Current Estimated Value
Home Financials for this Owner
Home Financials are based on the most recent Mortgage that was taken out on this home.
Original Mortgage
$15,000
Outstanding Balance
$13,188
Interest Rate
4.3%
Mortgage Type
Second Mortgage Made To Cover Down Payment
Estimated Equity
$212,390
Purchase Details
Closed on
Nov 17, 2014
Sold by
Foiles William M and Eleanor V Foiles Revocable Trust
Bought by
Whidden Richard T
Home Financials for this Owner
Home Financials are based on the most recent Mortgage that was taken out on this home.
Original Mortgage
$90,250
Interest Rate
4.26%
Mortgage Type
New Conventional
Purchase Details
Closed on
Aug 4, 2009
Sold by
Foiles Eleanor V
Bought by
Foiles William M and Eleanor V Foiles Revocable Tru
Purchase Details
Closed on
Jun 4, 2009
Sold by
Estate Of William D Foiles
Bought by
Foiles Eleanor V
Create a Home Valuation Report for This Property
The Home Valuation Report is an in-depth analysis detailing your home's value as well as a comparison with similar homes in the area
Home Values in the Area
Average Home Value in this Area
Purchase History
| Date | Buyer | Sale Price | Title Company |
|---|---|---|---|
| Collins Shaneta | $130,000 | None Available | |
| Whidden Richard T | $40,192 | -- | |
| Foiles William M | -- | -- | |
| Foiles Eleanor V | -- | -- |
Source: Public Records
Mortgage History
| Date | Status | Borrower | Loan Amount |
|---|---|---|---|
| Open | Collins Shaneta | $15,000 | |
| Previous Owner | Whidden Richard T | $90,250 |
Source: Public Records
Tax History Compared to Growth
Tax History
| Year | Tax Paid | Tax Assessment Tax Assessment Total Assessment is a certain percentage of the fair market value that is determined by local assessors to be the total taxable value of land and additions on the property. | Land | Improvement |
|---|---|---|---|---|
| 2024 | $1,069 | $149,500 | $0 | $0 |
| 2023 | $1,031 | $5,200 | $0 | $0 |
| 2022 | $3,759 | $130,000 | $20,000 | $110,000 |
| 2021 | $3,790 | $7,800 | $0 | $0 |
| 2020 | $3,843 | $7,800 | $0 | $0 |
| 2019 | $865 | $4,350 | $0 | $0 |
| 2018 | $769 | $3,780 | $0 | $0 |
| 2017 | $749 | $3,780 | $0 | $0 |
| 2016 | $722 | $3,780 | $0 | $0 |
| 2015 | $722 | $3,780 | $0 | $0 |
| 2014 | $3,387 | $121,200 | $0 | $0 |
| 2013 | -- | $7,270 | $0 | $0 |
Source: Public Records
Map
Nearby Homes
- 2309 Leesburg Rd
- 2132 Porter Dr
- 2110 Gayley St
- 1925 Beckley Dr
- 7245 Venus Rd
- 7037 Pisgah Dr
- 7525 Sunview Cir
- 7206 Sunview Cir
- 7101 Tama Rd
- 7428 Fairmont Rd
- 1631 Elmtree Rd
- 7308 Teague Rd
- 7819 Charles Towne Dr
- 2704 Leesburg Rd
- 1543 Joiner Rd
- 175 Nestle Ct
- 106 Colonial Commons Ln
- 113 Colonial Commons Ln
- 101 Colonial Commons Ln
- 1527 Burnside Ave
- 2216 Dunvegan Dr
- 2200 Dunvegan Dr
- 7024 Mirror Lake Rd
- 2232 Dunvegan Dr
- 7028 Mirror Lake Rd
- 7006 Mirror Lake Rd
- 2217 Dunvegan Dr
- 7019 Mirror Lake Rd
- 7015 Mirror Lake Rd
- 2240 Dunvegan Dr
- 7023 Mirror Lake Rd
- 7032 Mirror Lake Rd
- 7027 Mirror Lake Rd
- 7033 Glengarry Dr
- 7031 Mirror Lake Rd
- 2204 Leesburg Rd
- 2223 Leesburg Rd
- 2219 Leesburg Rd
- 2215 Leesburg Rd
- 2256 Dunvegan Dr