
Seller's Agent in 2018
Tram Chu
West USA Realty
(602) 326-2751
40 Total Sales
Estimated Value: $472,000 - $493,000
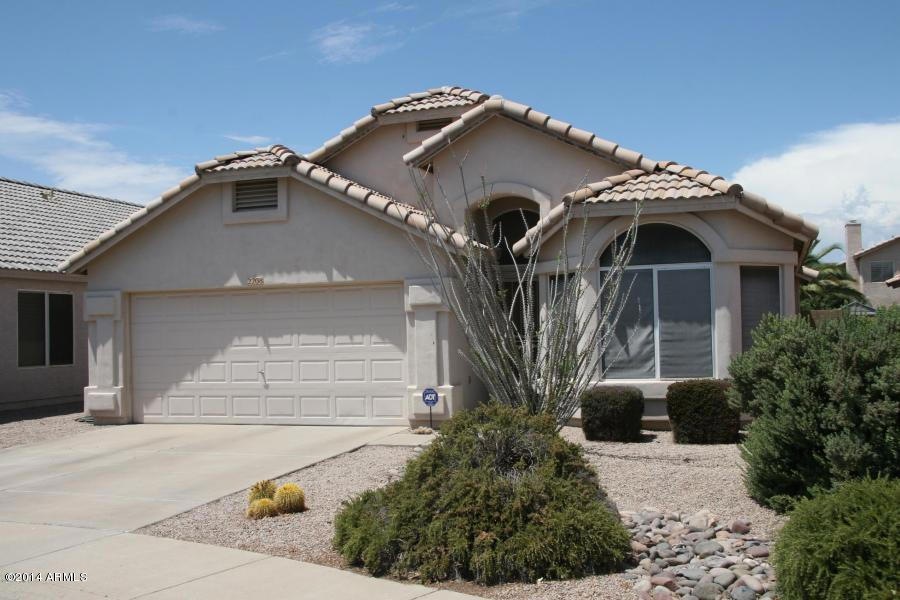
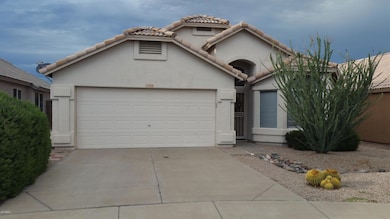
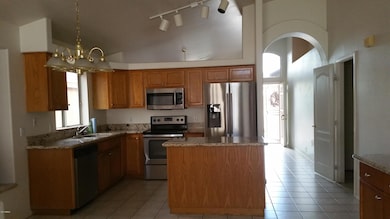
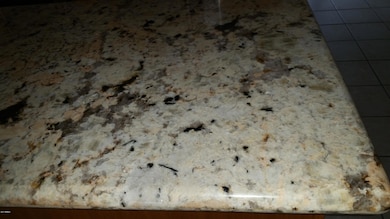
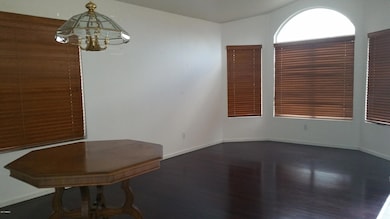
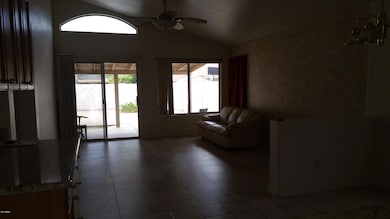
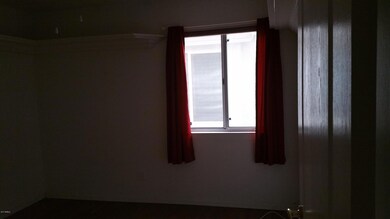
Back on the market!!!!Great family home with 3 brm 2 bath. Vaulted ceilings, ceiling fans, family room. Formal dinning room with bay window. Open kitchen with granite counter tops, 20X20 ceramic tile flooring in living room,bed rooms, kitchen and baths. Master bedroom has separate shower&tub. Covered patio,cul-desac. Citrus trees and small garden in backyard. North/South exposure. Refrigerator, washer & dryer are included in as is condition.
We collect this data history from publicly available records. To have your information removed, we recommend requesting removal directly through your county’s website.
We collect this data history from publicly available records. To have your information removed, we recommend requesting removal directly through your county’s website.
| Date | Buyer | Sale Price | Title Company |
|---|---|---|---|
| $272,000 | Chicago Title Agency Inc | ||
| $200,000 | Greystone Title Agency Llc | ||
| -- | -- | ||
| $155,000 | North American Title Agency | ||
| -- | First American Title | ||
| -- | First American Title | ||
| -- | Capital Title Agency | ||
| -- | Capital Title Agency | ||
| $140,000 | Capital Title Agency | ||
| $123,247 | First American Title |
We collect this data history from publicly available records. To have your information removed, we recommend requesting removal directly through your county’s website.
| Date | Status | Borrower | Loan Amount |
|---|---|---|---|
| Previous Owner | $196,377 | ||
| Previous Owner | $149,750 | ||
| Previous Owner | $147,250 | ||
| Previous Owner | $127,400 | ||
| Previous Owner | $96,000 |
We collect this data history from publicly available records. To have your information removed, we recommend requesting removal directly through your county’s website.
| Date | Event | Price | List to Sale | Price per Sq Ft | Prior Sale |
|---|---|---|---|---|---|
| 12/19/2018 12/19/18 | Sold | $272,000 | -1.1% | $169 / Sq Ft | |
| 12/05/2018 12/05/18 | For Sale | $275,000 | +1.1% | $170 / Sq Ft | |
| 12/01/2018 12/01/18 | Off Market | $272,000 | -- | -- | |
| 11/29/2018 11/29/18 | Pending | -- | -- | -- | |
| 11/26/2018 11/26/18 | For Sale | $275,000 | 0.0% | $170 / Sq Ft | |
| 11/18/2018 11/18/18 | Pending | -- | -- | -- | |
| 10/31/2018 10/31/18 | Price Changed | $275,000 | -1.8% | $170 / Sq Ft | |
| 09/26/2018 09/26/18 | For Sale | $279,900 | 0.0% | $173 / Sq Ft | |
| 09/06/2018 09/06/18 | Pending | -- | -- | -- | |
| 08/15/2018 08/15/18 | Price Changed | $279,900 | -1.8% | $173 / Sq Ft | |
| 07/19/2018 07/19/18 | For Sale | $285,000 | 0.0% | $177 / Sq Ft | |
| 07/19/2018 07/19/18 | Price Changed | $285,000 | 0.0% | $177 / Sq Ft | |
| 07/03/2018 07/03/18 | Pending | -- | -- | -- | |
| 05/18/2018 05/18/18 | For Sale | $285,000 | 0.0% | $177 / Sq Ft | |
| 09/15/2017 09/15/17 | Rented | $1,500 | 0.0% | -- | |
| 09/05/2017 09/05/17 | Under Contract | -- | -- | -- | |
| 08/15/2017 08/15/17 | Off Market | $1,500 | -- | -- | |
| 08/01/2017 08/01/17 | For Rent | $1,500 | +7.5% | -- | |
| 07/01/2015 07/01/15 | Rented | $1,395 | 0.0% | -- | |
| 07/01/2015 07/01/15 | Under Contract | -- | -- | -- | |
| 06/01/2015 06/01/15 | For Rent | $1,395 | 0.0% | -- | |
| 09/20/2013 09/20/13 | Sold | $200,000 | -4.6% | $124 / Sq Ft | View Prior Sale |
| 09/10/2013 09/10/13 | For Sale | $209,700 | 0.0% | $130 / Sq Ft | |
| 09/10/2013 09/10/13 | Price Changed | $209,700 | 0.0% | $130 / Sq Ft | |
| 08/11/2013 08/11/13 | Pending | -- | -- | -- | |
| 08/05/2013 08/05/13 | Price Changed | $209,700 | -3.3% | $130 / Sq Ft | |
| 08/05/2013 08/05/13 | Pending | -- | -- | -- | |
| 07/26/2013 07/26/13 | Price Changed | $216,890 | -0.5% | $134 / Sq Ft | |
| 07/14/2013 07/14/13 | For Sale | $217,890 | -- | $135 / Sq Ft |
We collect this data history from publicly available records. To have your information removed, we recommend requesting removal directly through your county’s website.
| Year | Tax Paid | Tax Assessment Tax Assessment Total Assessment is a certain percentage of the fair market value that is determined by local assessors to be the total taxable value of land and additions on the property. | Land | Improvement |
|---|---|---|---|---|
| 2025 | $1,816 | $21,636 | -- | -- |
| 2024 | $1,784 | $20,605 | -- | -- |
| 2023 | $1,784 | $34,530 | $6,900 | $27,630 |
| 2022 | $1,767 | $26,530 | $5,300 | $21,230 |
| 2021 | $1,796 | $24,850 | $4,970 | $19,880 |
| 2020 | $1,735 | $23,380 | $4,670 | $18,710 |
| 2019 | $1,743 | $21,730 | $4,340 | $17,390 |
| 2018 | $1,965 | $19,560 | $3,910 | $15,650 |
| 2017 | $1,883 | $18,620 | $3,720 | $14,900 |
| 2016 | $1,852 | $17,880 | $3,570 | $14,310 |
| 2015 | $1,464 | $15,970 | $3,190 | $12,780 |
Seller's Agent in 2018
Tram Chu
West USA Realty
(602) 326-2751
40 Total Sales
D
Seller Co-Listing Agent in 2018
Dalyla Dang
West USA Realty
(623) 594-7680
22 Total Sales
Buyer's Agent in 2018
Kaori Morie
HomeSmart
(480) 440-2542
3 in this area
28 Total Sales
C
Buyer's Agent in 2017
Christopher Danforth
eXp Realty
Buyer's Agent in 2015
Sherry Sentgeorge
Coldwell Banker Realty
(602) 618-7887
28 Total Sales
Seller's Agent in 2013
Alan Zieder
Russ Lyon Sotheby's International Realty
(602) 692-7200
1 in this area
25 Total Sales
Source: Arizona Regional Multiple Listing Service (ARMLS)
MLS Number: 5769432
APN: 213-26-175
Disclaimer: Certain information contained herein is derived from information provided by parties other than Homes.com. All information provided is deemed reliable, but is not guaranteed to be accurate and should be independently verified.
![]() All information should be verified by the recipient and none is guaranteed as accurate by ARMLS
All information should be verified by the recipient and none is guaranteed as accurate by ARMLS
Listing Information presented by local MLS brokerage: Ten-X, local REALTOR®- Arlene Richardson - (888)-952-6393
Ask me questions while you tour the home.