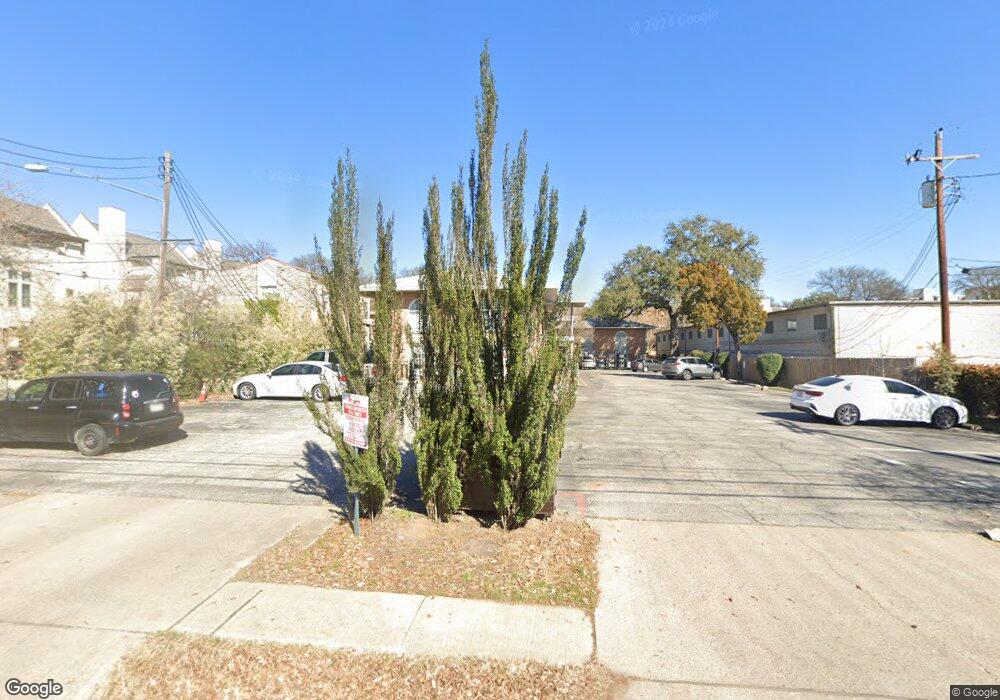
2208 Enfield Rd Unit 20100 Austin, TX 78703
Tarrytown NeighborhoodEstimated Value: $283,000 - $402,000
2
Beds
1
Bath
875
Sq Ft
$401/Sq Ft
Est. Value
About This Home
This home is located at 2208 Enfield Rd Unit 20100, Austin, TX 78703 and is currently estimated at $351,100, approximately $401 per square foot. 2208 Enfield Rd Unit 20100 is a home located in Travis County with nearby schools including Casis Elementary School, Austin High School, and Girls' School Of Austin.
Ownership History
Date
Name
Owned For
Owner Type
Purchase Details
Closed on
Nov 1, 2019
Sold by
Cray Matthew and Cray Matthew R
Bought by
Crayz Investments Llc
Current Estimated Value
Purchase Details
Closed on
May 25, 2018
Sold by
Ureste Noralinda
Bought by
Cray Matthew
Home Financials for this Owner
Home Financials are based on the most recent Mortgage that was taken out on this home.
Original Mortgage
$150,000
Outstanding Balance
$129,155
Interest Rate
4.4%
Mortgage Type
New Conventional
Estimated Equity
$221,945
Purchase Details
Closed on
Dec 13, 2002
Sold by
Taylor Natalie Lynn and Rhodes James Vernon
Bought by
Ureste Noralinda
Home Financials for this Owner
Home Financials are based on the most recent Mortgage that was taken out on this home.
Original Mortgage
$96,996
Interest Rate
6.05%
Mortgage Type
Seller Take Back
Create a Home Valuation Report for This Property
The Home Valuation Report is an in-depth analysis detailing your home's value as well as a comparison with similar homes in the area
Home Values in the Area
Average Home Value in this Area
Purchase History
| Date | Buyer | Sale Price | Title Company |
|---|---|---|---|
| Crayz Investments Llc | -- | None Available | |
| Cray Matthew | -- | None Available | |
| Ureste Noralinda | -- | Texas American Title Company |
Source: Public Records
Mortgage History
| Date | Status | Borrower | Loan Amount |
|---|---|---|---|
| Open | Cray Matthew | $150,000 | |
| Previous Owner | Ureste Noralinda | $96,996 |
Source: Public Records
Tax History Compared to Growth
Tax History
| Year | Tax Paid | Tax Assessment Tax Assessment Total Assessment is a certain percentage of the fair market value that is determined by local assessors to be the total taxable value of land and additions on the property. | Land | Improvement |
|---|---|---|---|---|
| 2025 | $5,747 | $308,725 | $115,921 | $192,804 |
| 2023 | $6,103 | $337,322 | $115,921 | $221,401 |
| 2022 | $6,824 | $345,547 | $91,288 | $254,259 |
| 2021 | $6,110 | $280,714 | $913 | $279,801 |
| 2020 | $4,826 | $225,000 | $72,451 | $152,549 |
| 2018 | $4,343 | $196,145 | $725 | $244,085 |
| 2017 | $3,977 | $178,314 | $725 | $226,987 |
| 2016 | $3,615 | $162,104 | $72,451 | $97,036 |
| 2015 | $2,844 | $147,367 | $72,451 | $91,013 |
| 2014 | $2,844 | $133,970 | $0 | $0 |
Source: Public Records
Map
Nearby Homes
- 2300 Enfield Rd Unit 303
- 2104 Enfield Rd
- 2404 Enfield Rd
- 2412 Enfield Rd Unit 10
- 2500 Enfield Rd Unit 2
- 2505 Enfield Rd Unit 3
- 2501 Inwood Place
- 2003 Woodmont Ave
- 2306 W 11th St
- 2109 W 12th St
- 1411 Norwalk Ln Unit 104
- 2507 Quarry Rd Unit D
- 1307 Norwalk Ln Unit 102
- 1307 Norwalk Ln Unit 104
- 2520 Quarry Rd Unit 204
- 2605 Enfield Rd Unit 209
- 1404 Norwalk Ln Unit 212
- 1502 Wethersfield Rd
- 1906 Vista Ln
- 2301 Horn Ln
- 2208 Enfield Rd Unit 206
- 2208 Enfield Rd Unit 105
- 2208 Enfield Rd Unit 103
- 2208 Enfield Rd Unit 106
- 2208 Enfield Rd Unit 20800
- 2208 Enfield Rd Unit 20700
- 2208 Enfield Rd Unit 20600
- 2208 Enfield Rd Unit 20500
- 2208 Enfield Rd Unit 20400
- 2208 Enfield Rd Unit 20300
- 2208 Enfield Rd Unit 202
- 2208 Enfield Rd Unit 10800
- 2208 Enfield Rd Unit 10700
- 2208 Enfield Rd Unit 10600
- 2208 Enfield Rd Unit 10500
- 2208 Enfield Rd Unit 10400
- 2208 Enfield Rd Unit 10200
- 2208 Enfield Rd Unit 10100
- 2208 Enfield Rd Unit 107
- 2208 Enfield Rd Unit 208