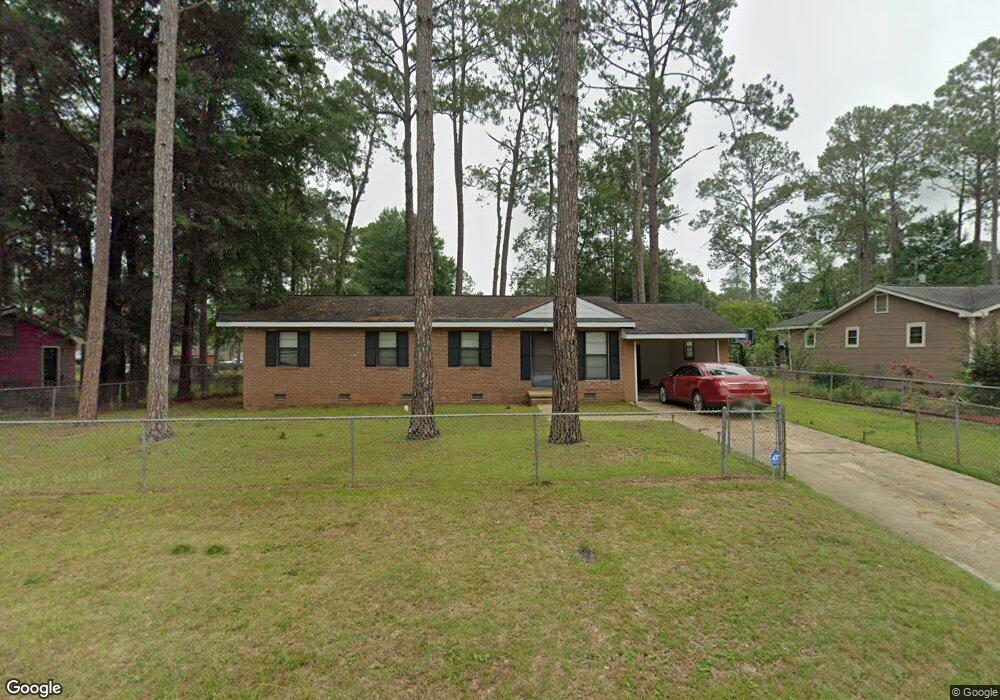
2208 Juniper Dr Albany, GA 31721
Estimated Value: $91,000 - $151,000
4
Beds
1
Bath
1,150
Sq Ft
$99/Sq Ft
Est. Value
About This Home
This home is located at 2208 Juniper Dr, Albany, GA 31721 and is currently estimated at $114,008, approximately $99 per square foot. 2208 Juniper Dr is a home located in Dougherty County with nearby schools including Alice Coachman Elementary School, Southside Middle School, and Monroe High School.
Ownership History
Date
Name
Owned For
Owner Type
Purchase Details
Closed on
Sep 30, 2022
Sold by
Jones Mary Inez
Bought by
Chester Showana N
Current Estimated Value
Home Financials for this Owner
Home Financials are based on the most recent Mortgage that was taken out on this home.
Original Mortgage
$84,442
Outstanding Balance
$81,091
Interest Rate
5.75%
Mortgage Type
FHA
Estimated Equity
$32,917
Purchase Details
Closed on
Aug 19, 2020
Sold by
Williams Clarence Lamar
Bought by
Jones Maryella Inez
Purchase Details
Closed on
Apr 29, 2019
Sold by
Paul Sarah Lee
Bought by
Jones Maryella Inez and Williams Clarence Lamar
Home Financials for this Owner
Home Financials are based on the most recent Mortgage that was taken out on this home.
Original Mortgage
$42,000
Interest Rate
4%
Mortgage Type
New Conventional
Purchase Details
Closed on
Oct 28, 2015
Sold by
Paul Andrew
Bought by
Paul Sarah Lee
Purchase Details
Closed on
May 11, 2004
Sold by
Paul Bulia Mae
Bought by
Paul Andrew
Purchase Details
Closed on
Oct 16, 1978
Sold by
Frison Sarah H
Bought by
Paul Andrew
Create a Home Valuation Report for This Property
The Home Valuation Report is an in-depth analysis detailing your home's value as well as a comparison with similar homes in the area
Home Values in the Area
Average Home Value in this Area
Purchase History
| Date | Buyer | Sale Price | Title Company |
|---|---|---|---|
| Chester Showana N | $86,000 | -- | |
| Jones Maryella Inez | -- | -- | |
| Jones Maryella Inez | $42,000 | -- | |
| Paul Sarah Lee | -- | -- | |
| Paul Andrew | -- | -- | |
| Paul Andrew | -- | -- |
Source: Public Records
Mortgage History
| Date | Status | Borrower | Loan Amount |
|---|---|---|---|
| Open | Chester Showana N | $84,442 | |
| Previous Owner | Jones Maryella Inez | $42,000 |
Source: Public Records
Tax History Compared to Growth
Tax History
| Year | Tax Paid | Tax Assessment Tax Assessment Total Assessment is a certain percentage of the fair market value that is determined by local assessors to be the total taxable value of land and additions on the property. | Land | Improvement |
|---|---|---|---|---|
| 2024 | $1,332 | $27,920 | $6,080 | $21,840 |
| 2023 | $1,301 | $27,920 | $6,080 | $21,840 |
| 2022 | $1,212 | $27,920 | $6,080 | $21,840 |
| 2021 | $1,124 | $27,920 | $6,080 | $21,840 |
| 2020 | $730 | $27,920 | $6,080 | $21,840 |
| 2019 | $1,218 | $27,920 | $6,080 | $21,840 |
| 2018 | $1,223 | $27,920 | $6,080 | $21,840 |
| 2017 | $1,139 | $27,920 | $6,080 | $21,840 |
| 2016 | $1,140 | $27,920 | $6,080 | $21,840 |
| 2015 | $867 | $27,920 | $6,080 | $21,840 |
| 2014 | $854 | $27,920 | $6,080 | $21,840 |
Source: Public Records
Map
Nearby Homes
- 2307 Evergreen Dr
- 2101 Goldendale Ln
- 6102 Newton Rd
- 2102 Techwood Dr
- 2303 Joel Dr
- 1918 Colquitt Ave
- 1104 University St
- 1029 Davidson Dr
- 1513 Colquitt Ave
- 1409 Colquitt Ave
- 2013 Jones Ave
- 802 Colquitt Cir
- 1003 University St
- 5404 Paulk Dr
- 1610 W Gordon Ave
- 1705 W Gordon Ave
- 1304 S Cleveland St
- 1207 S Cleveland St
- 1804 W Lincoln Ave
- 1714 W Lincoln Ave
- 2206 Juniper Dr
- 2210 Juniper Dr
- 2303 Evergreen Dr
- 2305 Evergreen Dr
- 2300 Juniper Dr
- 2204 Juniper Dr
- 2211 Juniper Dr
- 2209 Juniper Dr
- 2213 Juniper Dr
- 2207 Juniper Dr
- 2205 Hemlock Dr
- 2202 Juniper Dr
- 2302 Juniper Dr
- 2301 Juniper Dr
- 2301 Evergreen Dr
- 2205 Juniper Dr
- 2203 Hemlock Dr
- 2309 Evergreen Dr
- 2303 Juniper Dr
- 2203 Juniper Dr