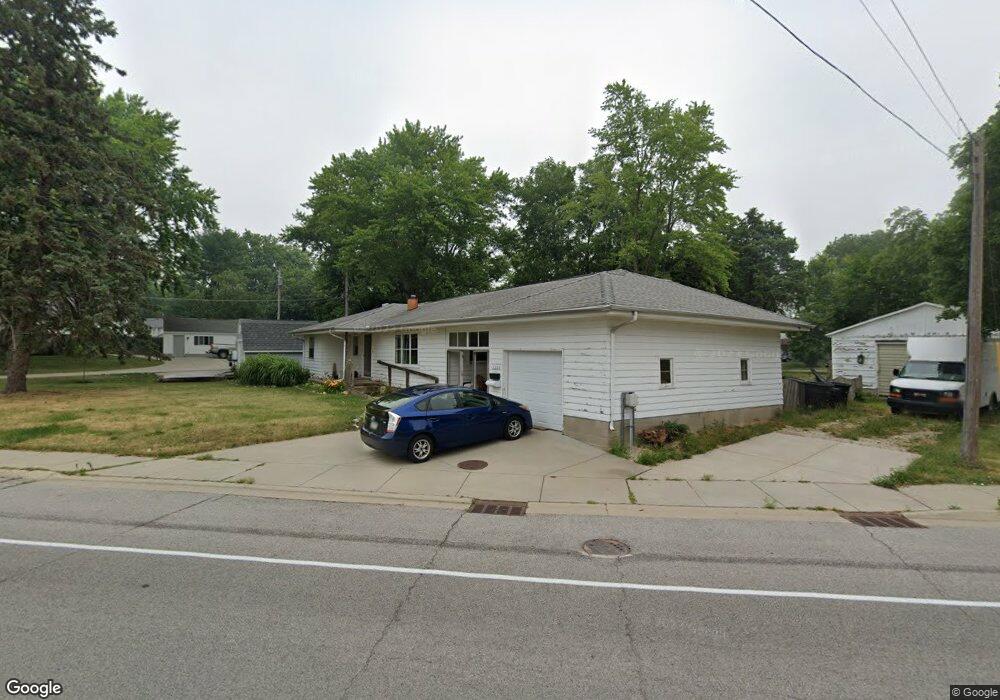
2208 State St Lafayette, IN 47905
South Oakland NeighborhoodEstimated Value: $197,000 - $241,000
Studio
--
Bath
1,504
Sq Ft
$148/Sq Ft
Est. Value
About This Home
This home is located at 2208 State St, Lafayette, IN 47905 and is currently estimated at $222,226, approximately $147 per square foot. 2208 State St is a home located in Tippecanoe County with nearby schools including Oakland Elementary School, Lafayette Tecumseh Junior High School, and Sunnyside Intermediate School.
Ownership History
Date
Name
Owned For
Owner Type
Purchase Details
Closed on
Jun 2, 2022
Sold by
Stevens Charles B
Bought by
Henady Patricia Y
Current Estimated Value
Home Financials for this Owner
Home Financials are based on the most recent Mortgage that was taken out on this home.
Original Mortgage
$153,000
Outstanding Balance
$145,350
Interest Rate
5.09%
Mortgage Type
New Conventional
Estimated Equity
$76,876
Purchase Details
Closed on
Jan 25, 2022
Sold by
Stevens Charles B
Bought by
Velten Bradley J and Velten Lydia M
Purchase Details
Closed on
Aug 30, 2011
Sold by
Stevens Charles I
Bought by
Stevens Charles B
Create a Home Valuation Report for This Property
The Home Valuation Report is an in-depth analysis detailing your home's value as well as a comparison with similar homes in the area
Home Values in the Area
Average Home Value in this Area
Purchase History
| Date | Buyer | Sale Price | Title Company |
|---|---|---|---|
| Henady Patricia Y | -- | Metropolitan Title | |
| Velten Bradley J | -- | None Listed On Document | |
| Stevens Charles B | -- | None Available | |
| Stevens Charles B | -- | None Available |
Source: Public Records
Mortgage History
| Date | Status | Borrower | Loan Amount |
|---|---|---|---|
| Open | Henady Patricia Y | $153,000 |
Source: Public Records
Tax History
| Year | Tax Paid | Tax Assessment Tax Assessment Total Assessment is a certain percentage of the fair market value that is determined by local assessors to be the total taxable value of land and additions on the property. | Land | Improvement |
|---|---|---|---|---|
| 2024 | $1,701 | $180,000 | $27,000 | $153,000 |
| 2023 | $1,668 | $167,100 | $27,000 | $140,100 |
| 2022 | $1,600 | $142,400 | $27,000 | $115,400 |
| 2021 | $2,612 | $126,600 | $27,000 | $99,600 |
| 2020 | $2,339 | $113,000 | $27,000 | $86,000 |
| 2019 | $2,050 | $98,600 | $16,200 | $82,400 |
| 2018 | $1,993 | $95,700 | $16,200 | $79,500 |
| 2017 | $1,915 | $92,100 | $16,200 | $75,900 |
| 2016 | $1,903 | $91,800 | $16,200 | $75,600 |
| 2014 | $1,901 | $91,900 | $16,200 | $75,700 |
| 2013 | $1,881 | $91,100 | $16,200 | $74,900 |
Source: Public Records
Map
Nearby Homes
Your Personal Tour Guide
Ask me questions while you tour the home.