Estimated Value: $402,000 - $428,000
3
Beds
1
Bath
1,284
Sq Ft
$324/Sq Ft
Est. Value
About This Home
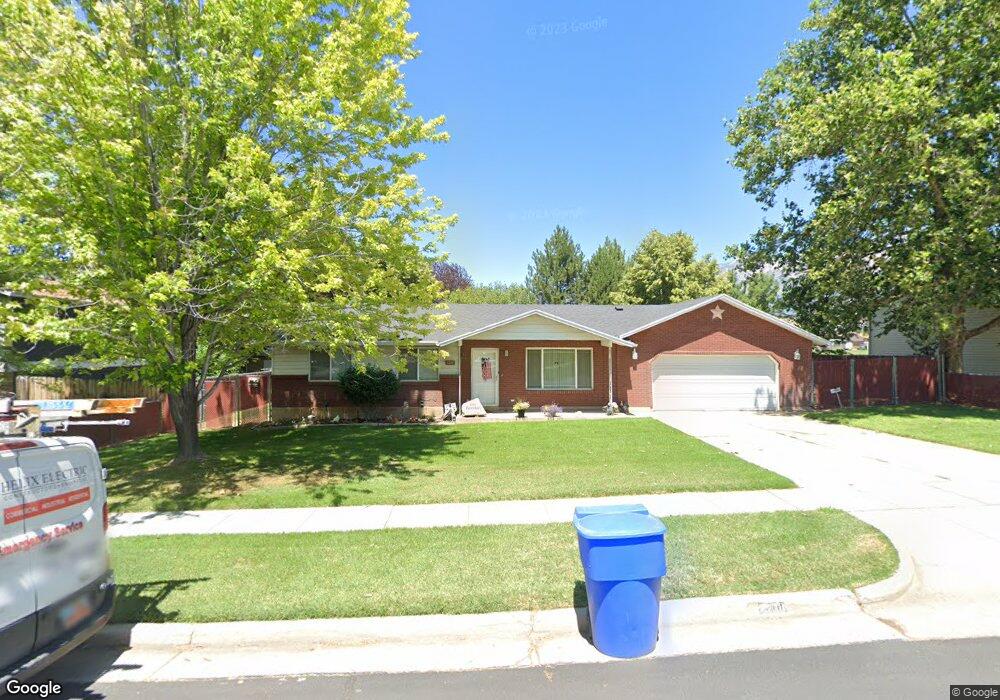
This home is located at 2208 W 2600 N, Ogden, UT 84404 and is currently estimated at $415,926, approximately $323 per square foot. 2208 W 2600 N is a home located in Weber County with nearby schools including Farr West Elementary School, Wahlquist Junior High School, and Fremont High School.
Ownership History
Date
Name
Owned For
Owner Type
Purchase Details
Closed on
Jun 17, 2020
Sold by
Ferrin Anita G and Ferrin Beverly Anita
Bought by
Ferrin Beverly Anita and Beverly Anita Ferrin Family Trust
Current Estimated Value
Purchase Details
Closed on
Jun 6, 2003
Sold by
Fields Billy C and Fields Kim M
Bought by
Ferrin Glaydon W and Ferrin Anita G
Purchase Details
Closed on
Apr 19, 2002
Sold by
Federal National Mortgage Association
Bought by
Fields Billy C and Fields Kim M
Home Financials for this Owner
Home Financials are based on the most recent Mortgage that was taken out on this home.
Original Mortgage
$106,600
Interest Rate
6.87%
Mortgage Type
Purchase Money Mortgage
Purchase Details
Closed on
Feb 12, 2002
Sold by
Citimortgage Inc
Bought by
Federal National Mortgage Association
Purchase Details
Closed on
Jan 24, 2002
Sold by
Roberts Laurie D
Bought by
Citimortgage Inc
Purchase Details
Closed on
Jan 23, 1997
Sold by
Roberts R Marc
Bought by
Roberts Laurie D
Create a Home Valuation Report for This Property
The Home Valuation Report is an in-depth analysis detailing your home's value as well as a comparison with similar homes in the area
Home Values in the Area
Average Home Value in this Area
Purchase History
| Date | Buyer | Sale Price | Title Company |
|---|---|---|---|
| Ferrin Beverly Anita | -- | None Available | |
| Ferrin Glaydon W | -- | Bonneville Title | |
| Fields Billy C | -- | Us Title | |
| Federal National Mortgage Association | -- | First American Title | |
| Citimortgage Inc | $64,024 | First American Title | |
| Roberts Laurie D | -- | U S Title |
Source: Public Records
Mortgage History
| Date | Status | Borrower | Loan Amount |
|---|---|---|---|
| Previous Owner | Fields Billy C | $106,600 |
Source: Public Records
Tax History Compared to Growth
Tax History
| Year | Tax Paid | Tax Assessment Tax Assessment Total Assessment is a certain percentage of the fair market value that is determined by local assessors to be the total taxable value of land and additions on the property. | Land | Improvement |
|---|---|---|---|---|
| 2025 | $1,004 | $383,283 | $125,622 | $257,661 |
| 2024 | $984 | $207,349 | $69,092 | $138,257 |
| 2023 | $918 | $193,600 | $69,012 | $124,588 |
| 2022 | $1,027 | $212,850 | $55,504 | $157,346 |
| 2021 | $747 | $280,000 | $66,660 | $213,340 |
| 2020 | $663 | $234,000 | $52,013 | $181,987 |
| 2019 | $674 | $219,000 | $48,415 | $170,585 |
| 2018 | $574 | $184,000 | $48,415 | $135,585 |
| 2017 | $516 | $162,000 | $38,633 | $123,367 |
| 2016 | $551 | $78,645 | $21,248 | $57,397 |
| 2015 | $660 | $69,809 | $21,248 | $48,561 |
| 2014 | $1,184 | $63,475 | $21,248 | $42,227 |
Source: Public Records
Map
Nearby Homes
- 2250 N 2000 W
- 2405 W 2825 N
- 2540 W 2575 N
- 2938 N 2350 W Unit 105
- 2442 W 2850 N
- 2942 N 2000 W
- 2409 W 2950 N
- 2409 W 2950 N Unit 101
- 2440 W 2900 N
- 2427 W 2950 N Unit 100
- 2427 W 2950 N
- 2477 W 2900 N
- 2414 W 2950 N Unit 110
- 2434 W 2950 N Unit 111
- 2434 W 2950 N
- 2485 W 2950 N
- 2519 W 2950 N
- 2524 W 2950 N
- 1700 W 2700 N Unit 10
- 1700 W 2700 N Unit 112