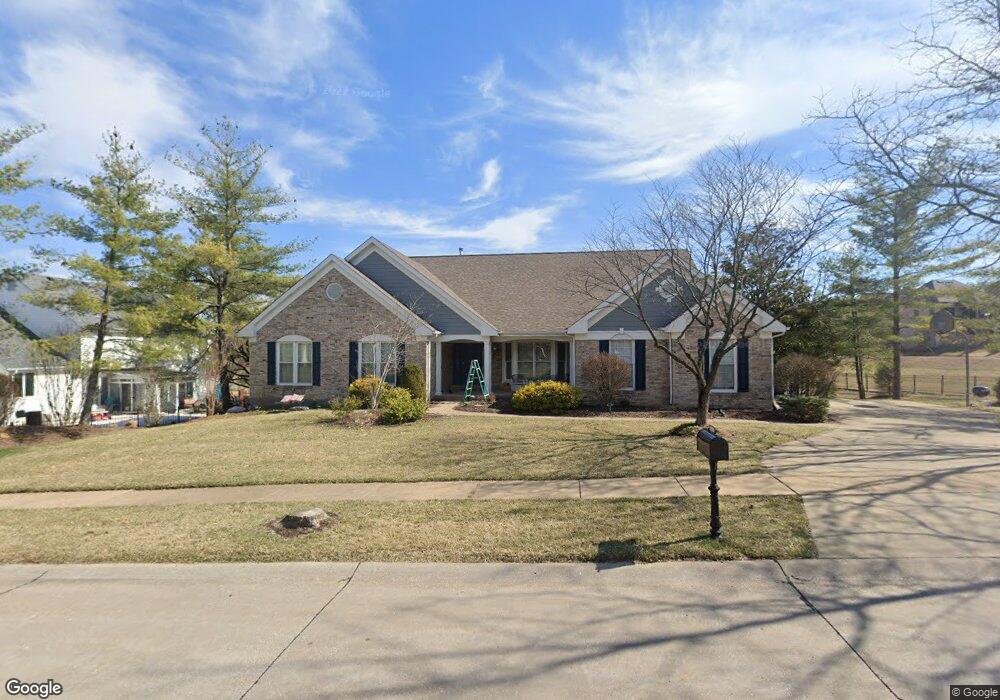
2208 Westerly Ct Chesterfield, MO 63017
Estimated Value: $760,660 - $1,005,000
4
Beds
4
Baths
3,963
Sq Ft
$219/Sq Ft
Est. Value
About This Home
This home is located at 2208 Westerly Ct, Chesterfield, MO 63017 and is currently estimated at $868,665, approximately $219 per square foot. 2208 Westerly Ct is a home located in St. Louis County with nearby schools including Henry Elementary School, Parkway West Middle School, and Parkway West High School.
Ownership History
Date
Name
Owned For
Owner Type
Purchase Details
Closed on
Mar 29, 2013
Sold by
Burch Robert M and Burch Cynthia L
Bought by
Burch Robert M and Burch Cynthia L
Current Estimated Value
Purchase Details
Closed on
May 30, 2002
Sold by
Biomerieux Inc
Bought by
Burch Robert M and Burch Cynthia L
Home Financials for this Owner
Home Financials are based on the most recent Mortgage that was taken out on this home.
Original Mortgage
$332,000
Outstanding Balance
$139,106
Interest Rate
6.82%
Estimated Equity
$729,559
Purchase Details
Closed on
Dec 19, 2001
Sold by
Rault Jean Paul Ker
Bought by
Biomerieux Inc
Purchase Details
Closed on
Oct 14, 1997
Sold by
Archinard Philippe A and Daniele Goupil
Bought by
Rault Jean Paul Ker
Home Financials for this Owner
Home Financials are based on the most recent Mortgage that was taken out on this home.
Original Mortgage
$225,400
Interest Rate
6.88%
Create a Home Valuation Report for This Property
The Home Valuation Report is an in-depth analysis detailing your home's value as well as a comparison with similar homes in the area
Home Values in the Area
Average Home Value in this Area
Purchase History
| Date | Buyer | Sale Price | Title Company |
|---|---|---|---|
| Burch Robert M | -- | None Available | |
| Burch Robert M | $415,000 | -- | |
| Biomerieux Inc | $325,000 | -- | |
| Rault Jean Paul Ker | -- | -- |
Source: Public Records
Mortgage History
| Date | Status | Borrower | Loan Amount |
|---|---|---|---|
| Open | Burch Robert M | $332,000 | |
| Previous Owner | Rault Jean Paul Ker | $225,400 |
Source: Public Records
Tax History Compared to Growth
Tax History
| Year | Tax Paid | Tax Assessment Tax Assessment Total Assessment is a certain percentage of the fair market value that is determined by local assessors to be the total taxable value of land and additions on the property. | Land | Improvement |
|---|---|---|---|---|
| 2025 | $7,398 | $134,350 | $39,120 | $95,230 |
| 2024 | $7,398 | $112,010 | $27,400 | $84,610 |
| 2023 | $7,095 | $112,010 | $27,400 | $84,610 |
| 2022 | $7,229 | $103,870 | $23,480 | $80,390 |
| 2021 | $7,199 | $103,870 | $23,480 | $80,390 |
| 2020 | $6,958 | $96,400 | $23,120 | $73,280 |
| 2019 | $6,806 | $96,400 | $23,120 | $73,280 |
| 2018 | $6,661 | $87,490 | $23,120 | $64,370 |
| 2017 | $6,479 | $87,490 | $23,120 | $64,370 |
| 2016 | $5,936 | $76,150 | $17,020 | $59,130 |
| 2015 | $6,223 | $76,150 | $17,020 | $59,130 |
| 2014 | $5,640 | $73,780 | $23,580 | $50,200 |
Source: Public Records
Map
Nearby Homes
- 14628 Amberleigh Hill Ct
- 14620 Amberleigh Hill Ct
- 2166 Bantry Ct Unit 26A
- 713 Clayton Corners Dr
- 718 Savannah Crossing Way
- 2237 Ole Castle Ct
- 603 Rue Montand Dr
- 606 Rue Montand Dr
- 2021 Brook Hill Ct
- 1864 Oxborough Ct
- 1870 Buckington Dr
- 14516 Crossway Ct
- 520 Kingridge Dr
- 2452 Claymoor Dr
- 449 Wildwood Pkwy
- 1620 Chalmers Dr
- 1596 Adgers Wharf Dr
- 15009 Claymoor Ct Unit 15
- 15009 Claymoor Ct Unit 11
- 15038 Claymoor Ct Unit 3
- 14714 Westerly Place
- 14710 Westerly Place
- 2207 Westerly Ct
- 14718 Westerly Place
- 14763 Schoettler Grove Ct
- 14709 Westerly Place
- 14706 Westerly Place
- 14722 Westerly Place
- 14755 Schoettler Grove Ct
- 14767 Schoettler Grove Ct
- 14707 Schoettler Grove Ct
- 14705 Westerly Place
- 2349 Schoettler Rd
- 14717 Westerly Place
- 14754 Schoettler Grove Ct
- 14730 Westerly Place
- 2297 Schoettler Rd
- 14751 Schoettler Grove Ct
- 14711 Schoettler Grove Ct
- 14771 Schoettler Grove Ct