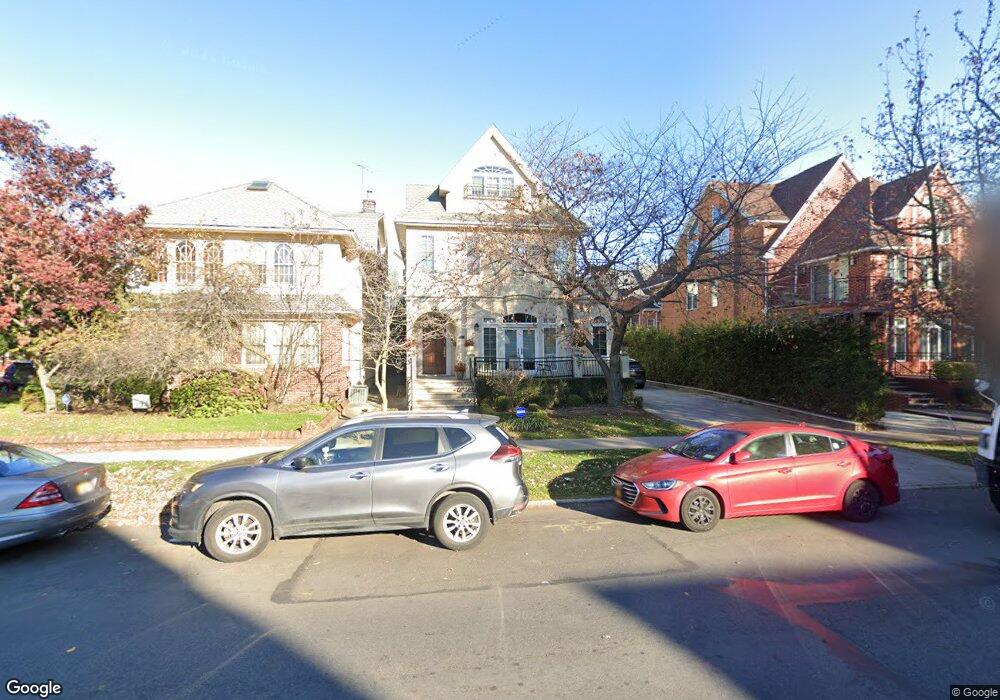
2209 Avenue I Brooklyn, NY 11210
Midwood NeighborhoodEstimated Value: $1,765,000 - $3,489,000
--
Bed
--
Bath
3,073
Sq Ft
$748/Sq Ft
Est. Value
About This Home
This home is located at 2209 Avenue I, Brooklyn, NY 11210 and is currently estimated at $2,300,026, approximately $748 per square foot. 2209 Avenue I is a home located in Kings County with nearby schools including P.S. 315, School of Science and Technology, and Jhs 234 Arthur W Cunningham.
Ownership History
Date
Name
Owned For
Owner Type
Purchase Details
Closed on
Aug 19, 2020
Sold by
2209 Avenue I Llc
Bought by
Schick Ann
Current Estimated Value
Home Financials for this Owner
Home Financials are based on the most recent Mortgage that was taken out on this home.
Original Mortgage
$891,000
Outstanding Balance
$787,104
Interest Rate
2.9%
Mortgage Type
Purchase Money Mortgage
Estimated Equity
$1,512,922
Purchase Details
Closed on
Jun 19, 2018
Sold by
Schick Ann Sheri and Schick Zev Nosson
Bought by
2209 Avenue I Llc
Home Financials for this Owner
Home Financials are based on the most recent Mortgage that was taken out on this home.
Original Mortgage
$800,000
Interest Rate
4.5%
Mortgage Type
Purchase Money Mortgage
Purchase Details
Closed on
Jan 23, 2009
Sold by
Schick Ann Sheri
Bought by
Schick Ann Sheri and Schick Zev Nosson
Purchase Details
Closed on
Jun 1, 2004
Sold by
Aurora Cassirer/ Chapter 11 Estate Of Da and Schick
Bought by
Schick Ann Sheri
Create a Home Valuation Report for This Property
The Home Valuation Report is an in-depth analysis detailing your home's value as well as a comparison with similar homes in the area
Home Values in the Area
Average Home Value in this Area
Purchase History
| Date | Buyer | Sale Price | Title Company |
|---|---|---|---|
| Schick Ann | -- | -- | |
| Schick Ann | -- | -- | |
| 2209 Avenue I Llc | -- | -- | |
| 2209 Avenue I Llc | -- | -- | |
| Schick Ann Sheri | -- | -- | |
| Schick Ann Sheri | -- | -- | |
| Schick Ann Sheri | -- | -- | |
| Schick Ann Sheri | -- | -- | |
| Schick Ann Sheri | -- | -- |
Source: Public Records
Mortgage History
| Date | Status | Borrower | Loan Amount |
|---|---|---|---|
| Open | Schick Ann | $891,000 | |
| Closed | Schick Ann | $891,000 | |
| Previous Owner | 2209 Avenue I Llc | $800,000 |
Source: Public Records
Tax History Compared to Growth
Tax History
| Year | Tax Paid | Tax Assessment Tax Assessment Total Assessment is a certain percentage of the fair market value that is determined by local assessors to be the total taxable value of land and additions on the property. | Land | Improvement |
|---|---|---|---|---|
| 2025 | $17,051 | $116,280 | $31,860 | $84,420 |
| 2024 | $17,051 | $100,260 | $31,860 | $68,400 |
| 2023 | $16,265 | $91,800 | $31,860 | $59,940 |
| 2022 | $15,083 | $76,260 | $31,860 | $44,400 |
| 2021 | $15,001 | $80,820 | $31,860 | $48,960 |
| 2020 | $7,457 | $101,340 | $31,860 | $69,480 |
| 2019 | $14,799 | $101,340 | $31,860 | $69,480 |
| 2018 | $13,605 | $66,741 | $17,863 | $48,878 |
| 2017 | $12,835 | $62,964 | $25,858 | $37,106 |
| 2016 | $11,875 | $59,400 | $27,692 | $31,708 |
| 2015 | $7,164 | $59,400 | $35,257 | $24,143 |
| 2014 | $7,164 | $58,955 | $34,993 | $23,962 |
Source: Public Records
Map
Nearby Homes
- 933 E 22nd St
- 2202 Avenue I
- 1375 Ocean Ave Unit 5J
- 1006 E 22nd St
- 1401 Ocean Ave Unit 5-F
- 2515 Avenue I
- 1912 Avenue H Unit 2B
- 839 E 19th St Unit 4D
- 3098 Bedford Ave
- 2415 Avenue J
- 3107 Bedford Ave
- 915 E 17th St Unit 109
- 915 E 17th St Unit 220
- 1710 Avenue H Unit F3
- 1710 Ave H Unit F6
- 927 E 27th St
- 1494 Ocean Ave Unit 1L
- 1021 E 24th St
- 680 E 23rd St
- 920 E 17th St Unit 122