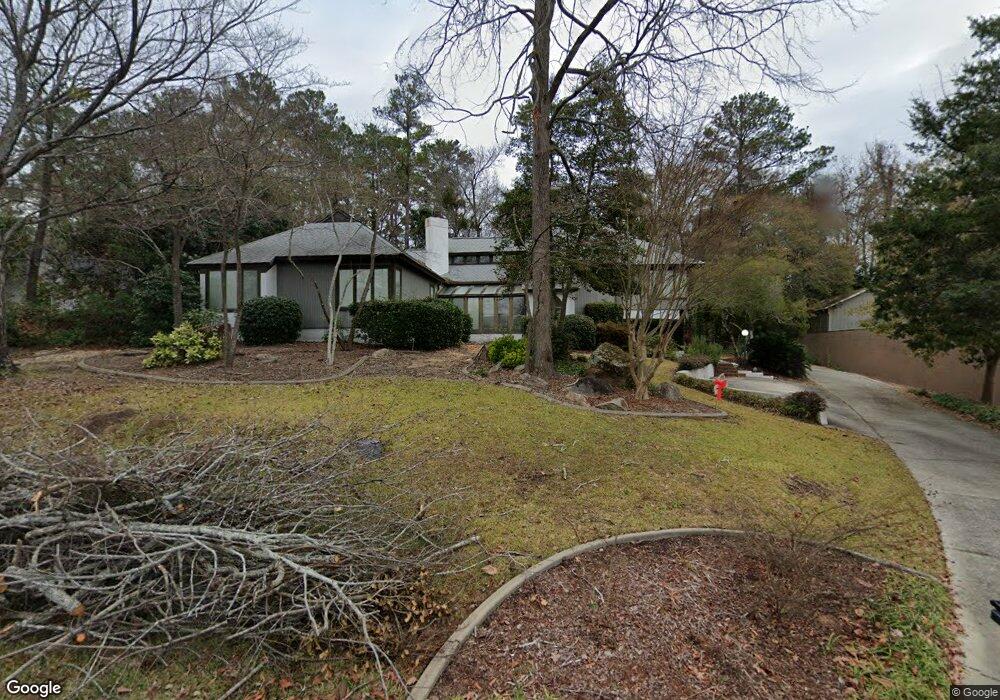
2209 Bob White Ln West Columbia, SC 29169
Estimated Value: $442,103 - $477,000
3
Beds
3
Baths
2,881
Sq Ft
$160/Sq Ft
Est. Value
About This Home
This home is located at 2209 Bob White Ln, West Columbia, SC 29169 and is currently estimated at $460,526, approximately $159 per square foot. 2209 Bob White Ln is a home located in Lexington County with nearby schools including Riverbank Elementary, Northside Middle, and Brookland-Cayce High School.
Ownership History
Date
Name
Owned For
Owner Type
Purchase Details
Closed on
Jun 28, 2024
Sold by
Legacy Susan W
Bought by
Rogers Brent A and Rogers Sarah J
Current Estimated Value
Home Financials for this Owner
Home Financials are based on the most recent Mortgage that was taken out on this home.
Original Mortgage
$380,000
Outstanding Balance
$375,461
Interest Rate
6.99%
Mortgage Type
New Conventional
Estimated Equity
$85,065
Purchase Details
Closed on
Mar 12, 2018
Sold by
Calderbank Charles Royle and Calderbank Valerie
Bought by
Legacy Susan W
Home Financials for this Owner
Home Financials are based on the most recent Mortgage that was taken out on this home.
Original Mortgage
$228,000
Interest Rate
4.38%
Mortgage Type
New Conventional
Purchase Details
Closed on
Jan 17, 2007
Sold by
Alessi Anita A and Alessi Thomas J
Bought by
Calderbank Charles Royle and Calderbank Valerie
Create a Home Valuation Report for This Property
The Home Valuation Report is an in-depth analysis detailing your home's value as well as a comparison with similar homes in the area
Home Values in the Area
Average Home Value in this Area
Purchase History
| Date | Buyer | Sale Price | Title Company |
|---|---|---|---|
| Rogers Brent A | $450,000 | None Listed On Document | |
| Legacy Susan W | $285,000 | None Available | |
| Calderbank Charles Royle | $278,650 | None Available |
Source: Public Records
Mortgage History
| Date | Status | Borrower | Loan Amount |
|---|---|---|---|
| Open | Rogers Brent A | $380,000 | |
| Previous Owner | Legacy Susan W | $228,000 |
Source: Public Records
Tax History Compared to Growth
Tax History
| Year | Tax Paid | Tax Assessment Tax Assessment Total Assessment is a certain percentage of the fair market value that is determined by local assessors to be the total taxable value of land and additions on the property. | Land | Improvement |
|---|---|---|---|---|
| 2024 | $1,614 | $11,400 | $1,800 | $9,600 |
| 2023 | $1,614 | $11,400 | $1,800 | $9,600 |
| 2022 | $1,616 | $11,400 | $1,800 | $9,600 |
| 2020 | $1,608 | $11,400 | $1,800 | $9,600 |
| 2019 | $1,642 | $11,400 | $2,000 | $9,400 |
| 2018 | $1,145 | $10,571 | $1,600 | $8,971 |
| 2017 | $1,091 | $10,571 | $1,600 | $8,971 |
| 2016 | $1,132 | $10,571 | $1,600 | $8,971 |
| 2014 | $810 | $11,216 | $1,600 | $9,616 |
| 2013 | -- | $11,220 | $1,600 | $9,620 |
Source: Public Records
Map
Nearby Homes
- 2420 Feather Run Trail
- 0 Quail Hollow Ln
- 106 Meadowview Ct
- 2225 Quail Hollow Ct
- 119 Meadowview Ct
- 709 Teakwood Ct
- 2641 Pine Lake Dr
- 910 Poinsett Place Unit 6
- 203 Holly Ridge Ln
- 1109 Hulon Ln
- 1605 Quail Lake Dr
- 1918 Pine Lake Dr
- 1906 Pine Lake Dr
- 1919 Pine Lake Dr
- 0 Terrace View Dr
- 2307 Chipmunk Ct
- 1280 Hulon Cir
- 600 Hulon Ln
- 2637 Pine Lake Dr
- 0 Mathias Rd Unit 592129
- 2213 Bob White Ln
- 2416 Feather Run Trail
- 2412 Feather Run Trail
- 2208 Bob White Ln
- 2204 Bob White Ln
- 2402 Feather Run Trail
- 2217 Bob White Ln
- 2408 Feather Run Trail
- 2200 Bob White Ln
- 2212 Bob White Ln
- 2424 Feather Run Trail
- 2421 Feather Run Trail
- 2425 Feather Run Trail
- 2108 Bob White Ln
- 2417 Feather Run Trail
- 2429 Feather Run Trail
- 2401 Feather Run Trail
- 2301 Bob White Ln
- 2300 Bob White Ln
- 2405 Feather Run Trail