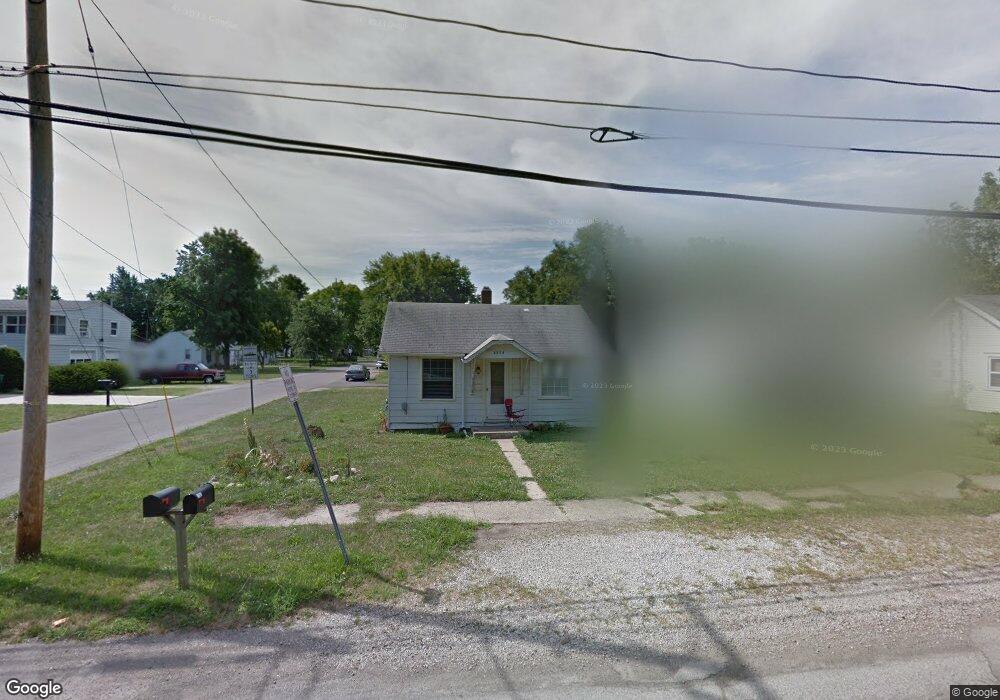
2209 E 8th St Muncie, IN 47302
Blaine NeighborhoodEstimated Value: $49,000 - $74,000
1
Bed
1
Bath
528
Sq Ft
$123/Sq Ft
Est. Value
About This Home
This home is located at 2209 E 8th St, Muncie, IN 47302 and is currently estimated at $64,692, approximately $122 per square foot. 2209 E 8th St is a home located in Delaware County with nearby schools including South View Elementary School, Muncie Central High School, and Southside Middle School.
Ownership History
Date
Name
Owned For
Owner Type
Purchase Details
Closed on
Dec 23, 2020
Sold by
Elliott Bernisa and Elliott Woodrow
Bought by
Elliott Property Rentals Llc
Current Estimated Value
Purchase Details
Closed on
Aug 3, 2017
Sold by
Hernandez Rakeshia
Bought by
Elliott Woodrow and Elliott Bernise
Purchase Details
Closed on
Oct 30, 2015
Sold by
Davis Joyce
Bought by
Hernandez Rakeshia D
Purchase Details
Closed on
Feb 14, 2012
Sold by
Sperry Tenia
Bought by
Davis Joyce
Purchase Details
Closed on
Feb 15, 2011
Sold by
Jones Ronald
Bought by
Sperry Tenia
Purchase Details
Closed on
Jul 14, 2010
Sold by
Krintz Larry and Krintz Larry Wayne
Bought by
Citibank Na
Purchase Details
Closed on
Oct 12, 2005
Sold by
Norton Donald J
Bought by
Krintz Larry and Krintz Deborah
Home Financials for this Owner
Home Financials are based on the most recent Mortgage that was taken out on this home.
Original Mortgage
$25,200
Interest Rate
8.37%
Mortgage Type
Adjustable Rate Mortgage/ARM
Create a Home Valuation Report for This Property
The Home Valuation Report is an in-depth analysis detailing your home's value as well as a comparison with similar homes in the area
Home Values in the Area
Average Home Value in this Area
Purchase History
| Date | Buyer | Sale Price | Title Company |
|---|---|---|---|
| Elliott Property Rentals Llc | -- | None Available | |
| Elliott Woodrow | -- | -- | |
| Hernandez Rakeshia D | -- | -- | |
| Davis Joyce | -- | None Available | |
| Sperry Tenia | -- | None Available | |
| Citibank Na | $3,870 | None Available | |
| Krintz Larry | -- | None Available |
Source: Public Records
Mortgage History
| Date | Status | Borrower | Loan Amount |
|---|---|---|---|
| Previous Owner | Krintz Larry | $25,200 |
Source: Public Records
Tax History
| Year | Tax Paid | Tax Assessment Tax Assessment Total Assessment is a certain percentage of the fair market value that is determined by local assessors to be the total taxable value of land and additions on the property. | Land | Improvement |
|---|---|---|---|---|
| 2025 | $816 | $43,100 | $4,700 | $38,400 |
| 2024 | $816 | $35,400 | $4,700 | $30,700 |
| 2023 | $680 | $28,600 | $4,200 | $24,400 |
| 2022 | $642 | $26,700 | $4,200 | $22,500 |
| 2021 | $558 | $22,500 | $3,700 | $18,800 |
| 2020 | $516 | $20,400 | $2,500 | $17,900 |
| 2019 | $524 | $20,800 | $4,100 | $16,700 |
| 2018 | $550 | $22,100 | $4,100 | $18,000 |
| 2017 | $544 | $21,800 | $3,900 | $17,900 |
| 2016 | $544 | $21,800 | $3,900 | $17,900 |
| 2014 | $265 | $22,200 | $3,900 | $18,300 |
| 2013 | -- | $21,900 | $3,900 | $18,000 |
Source: Public Records
Map
Nearby Homes
- 1527 S Ribble Ave
- 1118 S Walling Ave
- 1403 S Shipley St
- 1202 S Shipley St
- 2016 S Shipley St
- 1901 E 14th St
- 1100 S May Ave
- 1217 S Helen Dr
- 1402 E Willard St
- 1523 S Burlington Dr
- 1222 E 5th St
- 2007 S Penn St
- 1711 S Burlington Dr
- 2022 S Waldemere Ave
- 1224 S Beacon St
- 2113 S Waldemere Ave
- 2202 S Penn St
- 1311 E Kirby Ave
- 2108 S Grant St
- 1804 E 19th St
- 2207 E 8th St
- 2205 E 8th St
- 1503 S Ribble Ave
- 2301 E 8th St
- 1525 S Ribble Ave
- 2214 E 8th St
- 2307 E 8th St
- 2212 E 8th St
- 2201 E 8th St
- 2300 E 8th St
- 2304 E 8th St
- 1526 S Ribble Ave
- 1529 S Ribble Ave
- 2306 E 8th St
- 1530 S Ribble Ave
- 1501 S Luick Ave
- 1503 S Luick Ave
- 2312 E 8th St
- 1505 S Luick Ave
- 1505 S Luick Ave Unit Muncie
Your Personal Tour Guide
Ask me questions while you tour the home.