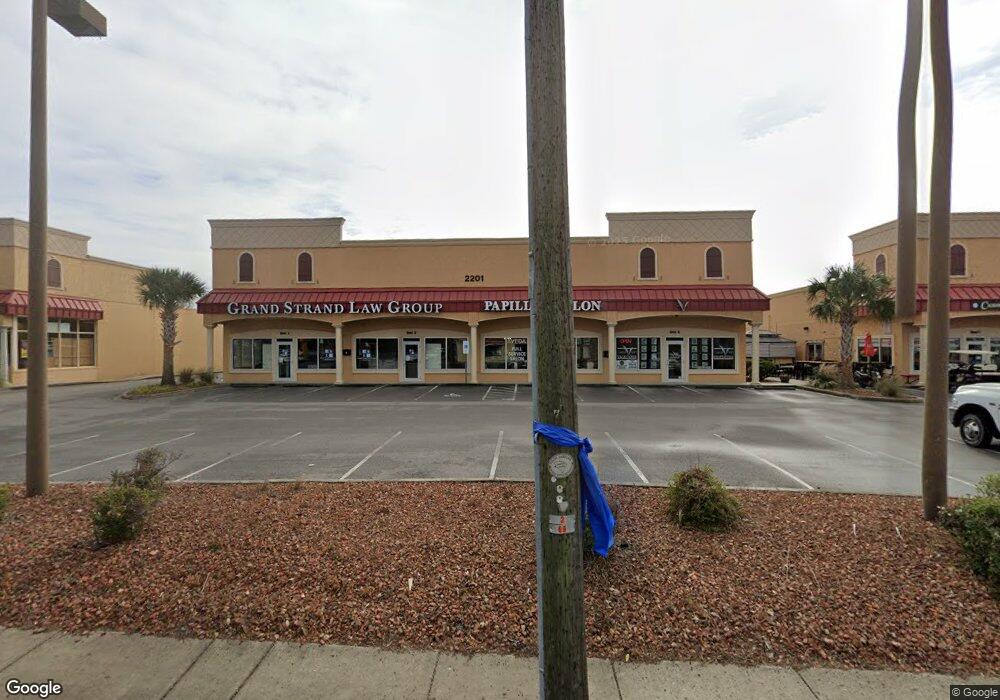
2209 Highway 17 S North Myrtle Beach, SC 29582
Crescent Beach NeighborhoodEstimated Value: $5,726,799
--
Bed
--
Bath
7,000
Sq Ft
$818/Sq Ft
Est. Value
About This Home
This home is located at 2209 Highway 17 S, North Myrtle Beach, SC 29582 and is currently estimated at $5,726,799, approximately $818 per square foot. 2209 Highway 17 S is a home located in Horry County with nearby schools including Ocean Drive Elementary School, North Myrtle Beach Middle School, and North Myrtle Beach High School.
Ownership History
Date
Name
Owned For
Owner Type
Purchase Details
Closed on
Oct 27, 2022
Sold by
Majestic Properties Of The Grand Strand
Bought by
Shoppes 521 Llc
Current Estimated Value
Home Financials for this Owner
Home Financials are based on the most recent Mortgage that was taken out on this home.
Original Mortgage
$3,450,000
Outstanding Balance
$3,342,430
Interest Rate
6.92%
Mortgage Type
New Conventional
Estimated Equity
$2,384,369
Purchase Details
Closed on
May 24, 2011
Sold by
Horry County State Bank
Bought by
Majestic Properties Of The Grand Strand
Purchase Details
Closed on
Dec 17, 2010
Sold by
Horry County State Bank
Bought by
Majestic Properties Of The Grand Strand
Purchase Details
Closed on
May 5, 2010
Sold by
Master In Equity Horry County
Bought by
Horry County State Bank
Purchase Details
Closed on
Oct 22, 2001
Sold by
Pavil Corp
Bought by
Pawak Inc
Create a Home Valuation Report for This Property
The Home Valuation Report is an in-depth analysis detailing your home's value as well as a comparison with similar homes in the area
Home Values in the Area
Average Home Value in this Area
Purchase History
| Date | Buyer | Sale Price | Title Company |
|---|---|---|---|
| Shoppes 521 Llc | $5,450,000 | -- | |
| Majestic Properties Of The Grand Strand | $390,000 | -- | |
| Majestic Properties Of The Grand Strand | $425,000 | -- | |
| Horry County State Bank | -- | -- | |
| Pawak Inc | $300,000 | -- |
Source: Public Records
Mortgage History
| Date | Status | Borrower | Loan Amount |
|---|---|---|---|
| Open | Shoppes 521 Llc | $3,450,000 |
Source: Public Records
Tax History Compared to Growth
Tax History
| Year | Tax Paid | Tax Assessment Tax Assessment Total Assessment is a certain percentage of the fair market value that is determined by local assessors to be the total taxable value of land and additions on the property. | Land | Improvement |
|---|---|---|---|---|
| 2024 | -- | $328,147 | $79,663 | $248,484 |
| 2023 | $75,245 | $160,696 | $57,258 | $103,438 |
| 2021 | $37,991 | $218,073 | $69,705 | $148,368 |
| 2020 | $35,965 | $218,073 | $69,705 | $148,368 |
| 2019 | $34,695 | $218,073 | $69,705 | $148,368 |
| 2018 | $31,973 | $139,735 | $49,789 | $89,946 |
| 2017 | $31,693 | $139,735 | $49,789 | $89,946 |
| 2016 | -- | $139,735 | $49,789 | $89,946 |
| 2015 | $31,414 | $139,736 | $49,790 | $89,946 |
| 2014 | $30,405 | $139,736 | $49,790 | $89,946 |
Source: Public Records
Map
Nearby Homes
- 702 22nd Ave S
- 511 22nd Ave S
- 806 20th Ave S
- 2010 Hillside Dr S
- 1911 Madison Dr
- 1909 Hwy 17 S
- 500 23rd Ave S
- 709 26th Ave S Unit M
- 707 26th Ave S Unit L
- 1901 Highway 17 S
- 405 21st Ave S Unit 2J
- 2419 Hilton Dr
- TBD Highway 17 S Unit .24 acres
- TBD Highway 17 S Unit next to Dick's Pawn
- 2005 Havens Dr
- 2301 Holly Dr
- 2204 Perrin Dr Unit 29
- 2104 Perrin Dr
- 505 19th Ave S
- 2012 Perrin Dr
- 2201-1 & 2 S Highway 17 S
- 2201-1 & 2 S Highway 17 S Unit Majestic Business Ce
- 2201 Highway 17 S
- 2201 Highway 17 S
- 2201 Highway 17 S Unit 4
- 2109 Highway 17 S
- 83.9 Acres Highway 22
- 2206 Highway 17 S
- 2111 Highway 17 S
- 709 22nd Ave S Unit B
- 709 22nd Ave S Unit A
- 709 22nd Ave S
- 1.98 acres N Hwy 17
- 1.98 acres Hwy 17 N
- 2103 Madison Dr Unit S A & B
- 2103 Madison Dr
- 706 22nd Ave S
- 708B 23rd Ave S
- 708A 23rd Ave S
- 707 22nd Ave S Unit A