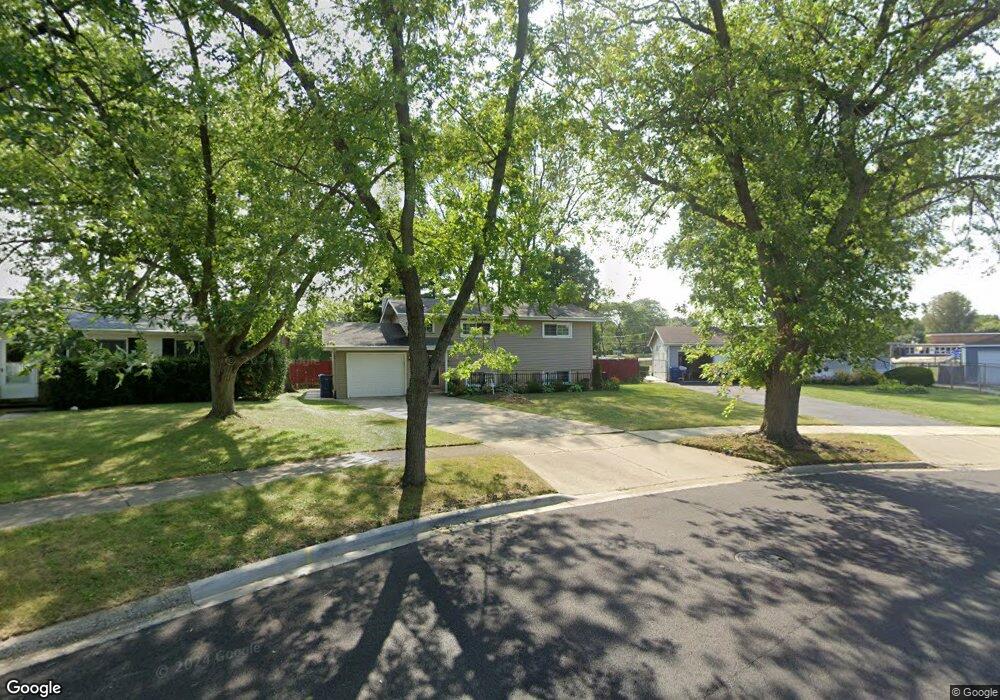
2209 Kingston Rd Waukegan, IL 60087
Estimated Value: $260,000 - $271,000
4
Beds
2
Baths
996
Sq Ft
$267/Sq Ft
Est. Value
About This Home
This home is located at 2209 Kingston Rd, Waukegan, IL 60087 and is currently estimated at $266,191, approximately $267 per square foot. 2209 Kingston Rd is a home located in Lake County with nearby schools including H R McCall Elementary School, Jack Benny Middle School, and Waukegan High School.
Ownership History
Date
Name
Owned For
Owner Type
Purchase Details
Closed on
May 30, 1997
Sold by
Najarro Paul W and Najarro Olga L
Bought by
Guerrero Juan I and Guerrero Irene
Current Estimated Value
Home Financials for this Owner
Home Financials are based on the most recent Mortgage that was taken out on this home.
Original Mortgage
$112,100
Outstanding Balance
$16,249
Interest Rate
8.13%
Estimated Equity
$249,942
Purchase Details
Closed on
Apr 13, 1995
Sold by
Najarro Jose B and Najarro Antonieta
Bought by
Najarro Paul W and Najarro Olga L
Home Financials for this Owner
Home Financials are based on the most recent Mortgage that was taken out on this home.
Original Mortgage
$95,000
Interest Rate
8.55%
Create a Home Valuation Report for This Property
The Home Valuation Report is an in-depth analysis detailing your home's value as well as a comparison with similar homes in the area
Home Values in the Area
Average Home Value in this Area
Purchase History
| Date | Buyer | Sale Price | Title Company |
|---|---|---|---|
| Guerrero Juan I | $118,000 | Burnett Title | |
| Najarro Paul W | $100,000 | Ticor Title Insurance Compan |
Source: Public Records
Mortgage History
| Date | Status | Borrower | Loan Amount |
|---|---|---|---|
| Open | Guerrero Juan I | $112,100 | |
| Previous Owner | Najarro Paul W | $95,000 |
Source: Public Records
Tax History Compared to Growth
Tax History
| Year | Tax Paid | Tax Assessment Tax Assessment Total Assessment is a certain percentage of the fair market value that is determined by local assessors to be the total taxable value of land and additions on the property. | Land | Improvement |
|---|---|---|---|---|
| 2024 | $5,923 | $78,387 | $14,270 | $64,117 |
| 2023 | $5,923 | $70,815 | $12,891 | $57,924 |
| 2022 | $5,639 | $63,679 | $11,862 | $51,817 |
| 2021 | $5,429 | $58,070 | $11,296 | $46,774 |
| 2020 | $5,226 | $54,100 | $10,524 | $43,576 |
| 2019 | $5,189 | $49,574 | $9,644 | $39,930 |
| 2018 | $4,839 | $43,807 | $12,481 | $31,326 |
| 2017 | $4,660 | $38,757 | $11,042 | $27,715 |
| 2016 | $4,277 | $33,678 | $9,595 | $24,083 |
| 2015 | $4,078 | $30,143 | $8,588 | $21,555 |
| 2014 | $3,232 | $24,642 | $6,135 | $18,507 |
| 2012 | $4,226 | $26,698 | $6,646 | $20,052 |
Source: Public Records
Map
Nearby Homes
- 3211 Rugby Ct
- 3101 Country Club Ln
- 3411 N Lewis Ave
- 37966 N Cornell Rd
- 1636 Rice St
- 12312 W Audrey Ave
- 1612 Whitney St
- 2613 N Lewis Ave
- 1730 W Beach Rd
- 2708 Dana Ave
- 38127 N Shore Ave
- 2705 Dana Ave
- 38683 N Lewis Ave
- 38362 N Manor Ave
- 37905 N Loyola Ave
- 2350 N Lewis Ave
- 12582 W Beach Rd
- 36955 N Garrick Ave
- 2713 Varonen Ave
- 38697 N Cedar Ave
- 3206 Twyford Rd
- 2205 Kingston Rd
- 3210 Twyford Rd
- 2201 Kingston Rd
- 2130 Kingston Rd
- 2125 Kingston Rd Unit 2
- 3214 Twyford Rd
- 3213 Twyford Rd
- 2121 Kingston Rd
- 3218 Twyford Rd
- 2126 Kingston Rd
- 2124 Castle Ct
- 3217 Twyford Rd
- 2117 Kingston Rd
- 3220 Twyford Rd
- 2120 Castle Ct
- 3221 Twyford Rd
- 2113 Kingston Rd
- 3226 Twyford Rd
- 2118 Castle Ct