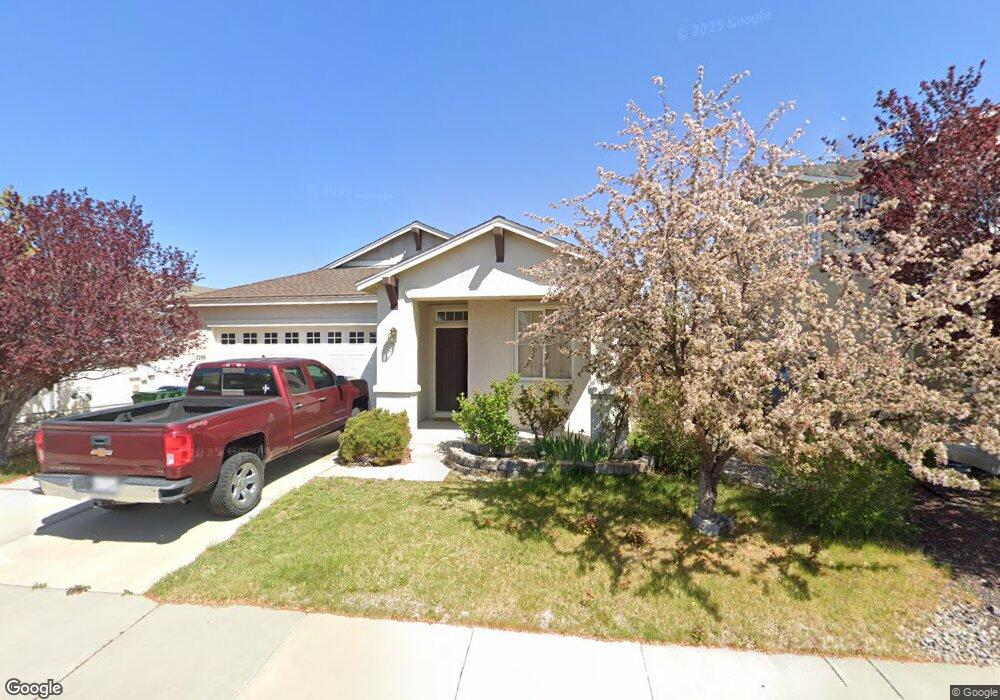
2209 Rio Lobo Ln Unit 16B Reno, NV 89521
Virginia Foothills NeighborhoodEstimated Value: $583,872 - $598,000
4
Beds
2
Baths
1,650
Sq Ft
$359/Sq Ft
Est. Value
About This Home
This home is located at 2209 Rio Lobo Ln Unit 16B, Reno, NV 89521 and is currently estimated at $591,968, approximately $358 per square foot. 2209 Rio Lobo Ln Unit 16B is a home located in Washoe County with nearby schools including Jwood Raw Elementary School, Kendyl Depoali Middle School, and Damonte Ranch High School.
Ownership History
Date
Name
Owned For
Owner Type
Purchase Details
Closed on
Nov 22, 2011
Sold by
Jones Jeremiah D
Bought by
Liu Sylvia
Current Estimated Value
Home Financials for this Owner
Home Financials are based on the most recent Mortgage that was taken out on this home.
Original Mortgage
$60,000
Outstanding Balance
$6,094
Interest Rate
4.09%
Mortgage Type
New Conventional
Estimated Equity
$585,874
Purchase Details
Closed on
Oct 10, 2006
Sold by
Jones Danny and Jones Nidia
Bought by
Jones Jeremiah D
Purchase Details
Closed on
Oct 9, 2006
Sold by
Jones Jesse H
Bought by
Jones Danny and Jones Nidia
Purchase Details
Closed on
Jan 6, 2005
Sold by
Centex Homes
Bought by
Jones Jesse H
Home Financials for this Owner
Home Financials are based on the most recent Mortgage that was taken out on this home.
Original Mortgage
$214,760
Interest Rate
5.12%
Mortgage Type
Unknown
Create a Home Valuation Report for This Property
The Home Valuation Report is an in-depth analysis detailing your home's value as well as a comparison with similar homes in the area
Home Values in the Area
Average Home Value in this Area
Purchase History
| Date | Buyer | Sale Price | Title Company |
|---|---|---|---|
| Liu Sylvia | $163,000 | Western Title Company | |
| Jones Jeremiah D | -- | None Available | |
| Jones Danny | -- | None Available | |
| Jones Jesse H | $268,500 | Commerce Title Company |
Source: Public Records
Mortgage History
| Date | Status | Borrower | Loan Amount |
|---|---|---|---|
| Open | Liu Sylvia | $60,000 | |
| Previous Owner | Jones Jesse H | $214,760 | |
| Closed | Jones Jesse H | $40,268 |
Source: Public Records
Tax History Compared to Growth
Tax History
| Year | Tax Paid | Tax Assessment Tax Assessment Total Assessment is a certain percentage of the fair market value that is determined by local assessors to be the total taxable value of land and additions on the property. | Land | Improvement |
|---|---|---|---|---|
| 2025 | $2,691 | $113,534 | $40,731 | $72,803 |
| 2024 | $2,691 | $109,731 | $36,442 | $73,289 |
| 2023 | $1,892 | $109,675 | $40,332 | $69,343 |
| 2022 | $2,537 | $90,831 | $33,117 | $57,714 |
| 2021 | $2,463 | $85,793 | $28,429 | $57,364 |
| 2020 | $2,390 | $85,843 | $28,429 | $57,414 |
| 2019 | $2,321 | $82,300 | $26,766 | $55,534 |
| 2018 | $2,250 | $76,648 | $22,444 | $54,204 |
| 2017 | $2,187 | $75,638 | $21,413 | $54,225 |
| 2016 | $2,132 | $73,842 | $18,587 | $55,255 |
| 2015 | $2,128 | $68,414 | $13,167 | $55,247 |
| 2014 | $2,026 | $66,497 | $13,899 | $52,598 |
| 2013 | -- | $53,377 | $9,244 | $44,133 |
Source: Public Records
Map
Nearby Homes
- 10825 Farmstead Ln
- 2520 Country Falls Ln Unit 15B
- 10650 Cedar Bend Ct
- 10630 Birch Point Ct
- 10677 Foxberry Park Dr
- 10735 Copper Lake Dr Unit 15A
- 2590 Spring Flower Dr
- 10643 Brittany Park Dr
- 10698 Autumn Walk Ln
- 40S Se4nw4-S16 18n 21e
- 40S Nw4sw4-S16 18n 21e
- 40S Sw4nw4-S16 18n 21e
- 40S Nw4nw4-S16 18n 21e
- 2348 Hammer Falls Dr
- 10595 Baton Ct
- 2432 Kate's Bridge Dr Unit Glenwood 546
- 12518 Brass Ridge St
- 1876 Braemore Dr
- 1920 Wind Ranch Rd Unit C
- 1932 Wind Ranch Rd Unit C
- 2201 Rio Lobo Ln
- 2217 Rio Lobo Ln
- 2236 Big Trail Cir
- 2225 Rio Lobo Ln
- 2218 Big Trail Cir Unit 16B
- 2300 Clementine Ln
- 2238 Big Trail Cir
- 2248 Big Trail Cir
- 2233 Rio Lobo Ln Unit 16B
- 2306 Clementine Ln
- 2250 Big Trail Cir Unit 16A
- 2233 Big Trail Cir
- 2231 Big Trail Cir
- 2235 Big Trail Cir
- 2216 Big Trail Cir
- 2241 Rio Lobo Ln Unit 16B
- 2237 Big Trail Cir
- 2227 Big Trail Cir
- 2214 Big Trail Cir
- 2305 Clementine Ln