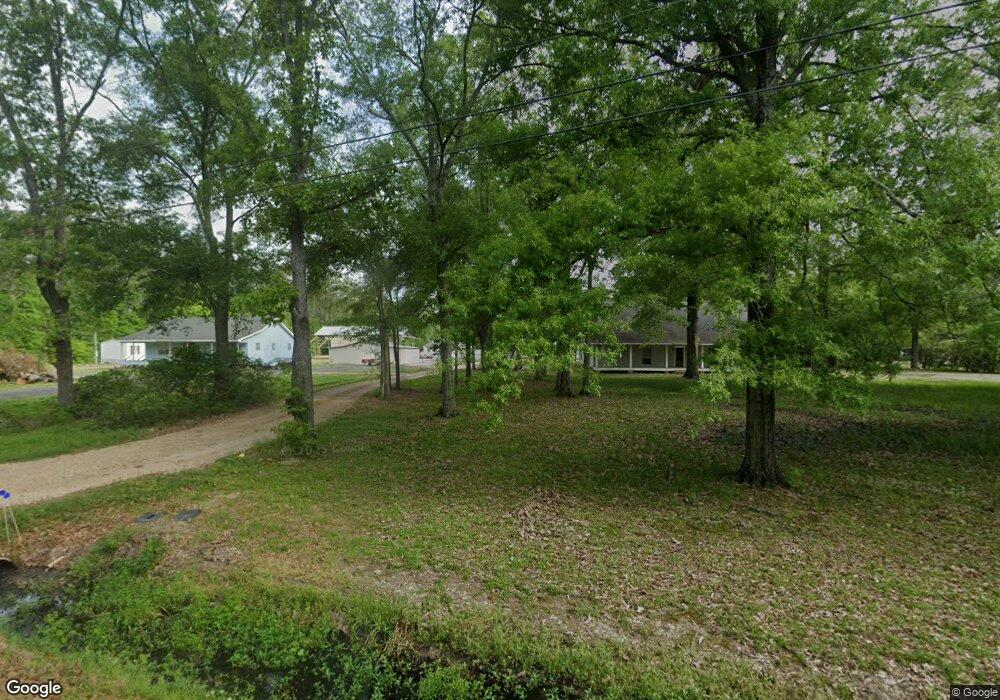
22093 Floyd Lavigne Rd Ponchatoula, LA 70454
Estimated Value: $278,330 - $311,000
4
Beds
3
Baths
1,905
Sq Ft
$158/Sq Ft
Est. Value
About This Home
This home is located at 22093 Floyd Lavigne Rd, Ponchatoula, LA 70454 and is currently estimated at $300,333, approximately $157 per square foot. 22093 Floyd Lavigne Rd is a home located in Tangipahoa Parish with nearby schools including Perrin Early Learning Center, Tucker Memorial Elementary School, and D.C. Reeves Elementary School.
Ownership History
Date
Name
Owned For
Owner Type
Purchase Details
Closed on
Feb 22, 2021
Sold by
Hart Eric J
Bought by
Hart-Wall Carly and Wall Jonathan
Current Estimated Value
Home Financials for this Owner
Home Financials are based on the most recent Mortgage that was taken out on this home.
Original Mortgage
$225,834
Outstanding Balance
$201,984
Interest Rate
2.7%
Mortgage Type
Purchase Money Mortgage
Estimated Equity
$98,349
Purchase Details
Closed on
Jul 11, 2006
Sold by
Casey Jay Harold and Casey Erin Mclin
Bought by
Hart Eric James and Hart Elizabeth Ann Rooney
Home Financials for this Owner
Home Financials are based on the most recent Mortgage that was taken out on this home.
Original Mortgage
$120,000
Interest Rate
6.21%
Mortgage Type
Future Advance Clause Open End Mortgage
Create a Home Valuation Report for This Property
The Home Valuation Report is an in-depth analysis detailing your home's value as well as a comparison with similar homes in the area
Home Values in the Area
Average Home Value in this Area
Purchase History
| Date | Buyer | Sale Price | Title Company |
|---|---|---|---|
| Hart-Wall Carly | $230,000 | None Available | |
| Hart Eric James | $210,000 | Hammond Title Company Inc |
Source: Public Records
Mortgage History
| Date | Status | Borrower | Loan Amount |
|---|---|---|---|
| Open | Hart-Wall Carly | $225,834 | |
| Previous Owner | Hart Eric James | $120,000 |
Source: Public Records
Tax History Compared to Growth
Tax History
| Year | Tax Paid | Tax Assessment Tax Assessment Total Assessment is a certain percentage of the fair market value that is determined by local assessors to be the total taxable value of land and additions on the property. | Land | Improvement |
|---|---|---|---|---|
| 2024 | $1,828 | $18,332 | $3,629 | $14,703 |
| 2023 | $1,842 | $18,218 | $3,360 | $14,858 |
| 2022 | $1,842 | $18,218 | $3,360 | $14,858 |
| 2021 | $1,089 | $18,218 | $3,360 | $14,858 |
| 2020 | $1,252 | $12,389 | $1,008 | $11,381 |
| 2019 | $1,249 | $12,389 | $1,008 | $11,381 |
| 2018 | $1,253 | $12,389 | $1,008 | $11,381 |
| 2017 | $1,252 | $12,389 | $1,008 | $11,381 |
| 2016 | $1,252 | $12,389 | $1,008 | $11,381 |
| 2015 | $531 | $12,744 | $1,008 | $11,736 |
| 2014 | $499 | $12,744 | $1,008 | $11,736 |
Source: Public Records
Map
Nearby Homes
- 22101 Floyd Lavigne Rd
- 21508 Weinberger Rd
- 22084 Morgan Howes Rd
- 21278 Weinberger Rd
- 21266 Weinberger Rd
- 21254 Weinberger Rd
- 0 Howes Cemetery Rd
- 21278 Lake Maurepas Ct
- 39268 Twin Lakes Blvd
- 39505 Rue de Fleur
- 39497 Rue de Fleur
- 39673 Poche Rd
- 39642 Fairhope Dr
- Tract D-2 Poche Rd
- 0 Wesley Chapel Unit 2507332
- 0 Unit 2507332
- 21315 Highway 22
- 21315 Highway 22 None
- 22121 Floyd Lavigne Rd
- 22097 Floyd Lavigne Rd
- 39064 S Thibodeaux Rd
- 22079 Floyd Lavigne Rd
- 22071 Floyd Lavigne Rd
- 22149 Sue's Ln
- 22147 Floyd Lavigne Rd
- 22150 Sue's Ln
- 22072 Floyd Lavigne Rd
- 0 Sue's Ln
- 22080 Sue's Ln
- 22117 Floyd Lavigne Rd
- 39072 S Thibodeaux Rd
- 22056 Floyd Lavigne Rd
- 22056 Floyd Lavigne Rd
- 5 Floyd Lavigne Rd
- 39016 S Thibodeaux Rd
- 39090 S Thibodeaux Rd
- 39050 S Thibodeaux Rd
- 22175 Floyd Lavigne Rd