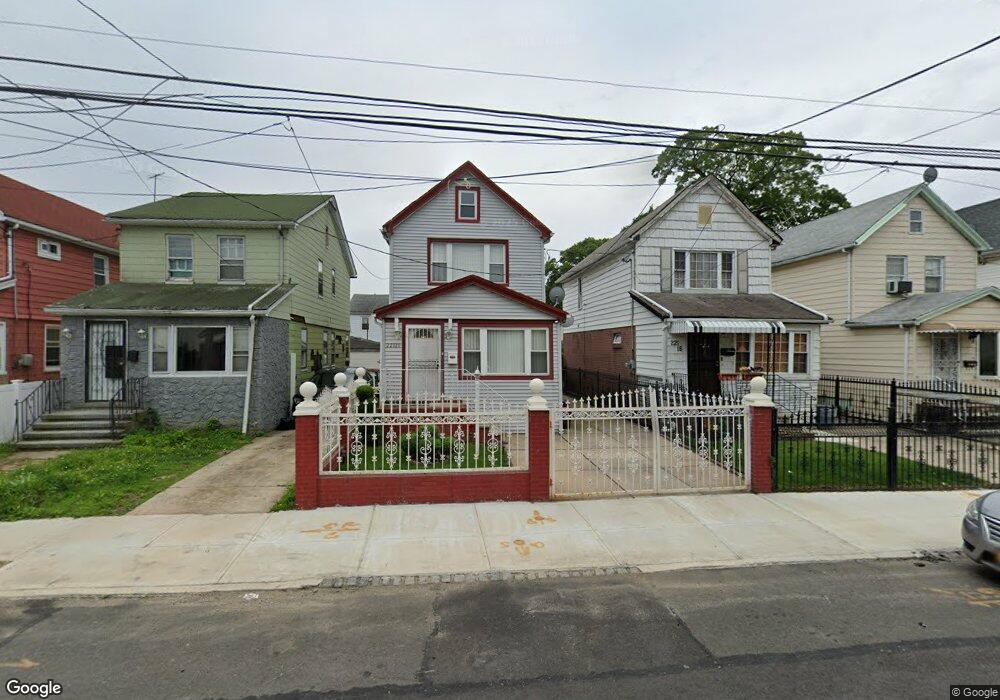
221-20 107th Ave Jamaica, NY 11429
Queens Village NeighborhoodEstimated Value: $646,000 - $787,000
--
Bed
--
Bath
1,232
Sq Ft
$560/Sq Ft
Est. Value
About This Home
This home is located at 221-20 107th Ave, Jamaica, NY 11429 and is currently estimated at $690,089, approximately $560 per square foot. 221-20 107th Ave is a home located in Queens County with nearby schools including P.S. 34 John Harvard, Jean Nuzzi Intermediate School, and Ss Joachim & Anne School.
Ownership History
Date
Name
Owned For
Owner Type
Purchase Details
Closed on
Apr 17, 2012
Sold by
Getmore Homes Inc
Bought by
Fonts Ricardo V and Grullon Elsa
Current Estimated Value
Home Financials for this Owner
Home Financials are based on the most recent Mortgage that was taken out on this home.
Original Mortgage
$302,242
Outstanding Balance
$207,619
Interest Rate
3.87%
Mortgage Type
FHA
Estimated Equity
$482,470
Purchase Details
Closed on
Nov 21, 2011
Sold by
Sanon Gardy and Sanon Pauline
Bought by
Getmore Homes Inc
Purchase Details
Closed on
May 3, 2005
Sold by
Hussein Faizal and Singh-Hussein Raynooka
Bought by
Sanon Gardy and Sanon Pauline
Home Financials for this Owner
Home Financials are based on the most recent Mortgage that was taken out on this home.
Original Mortgage
$316,000
Interest Rate
5.95%
Mortgage Type
Purchase Money Mortgage
Create a Home Valuation Report for This Property
The Home Valuation Report is an in-depth analysis detailing your home's value as well as a comparison with similar homes in the area
Home Values in the Area
Average Home Value in this Area
Purchase History
| Date | Buyer | Sale Price | Title Company |
|---|---|---|---|
| Fonts Ricardo V | $315,000 | -- | |
| Fonts Ricardo V | $315,000 | -- | |
| Getmore Homes Inc | $188,000 | -- | |
| Getmore Homes Inc | $188,000 | -- | |
| Sanon Gardy | $395,000 | -- | |
| Sanon Gardy | $395,000 | -- |
Source: Public Records
Mortgage History
| Date | Status | Borrower | Loan Amount |
|---|---|---|---|
| Open | Fonts Ricardo V | $302,242 | |
| Closed | Fonts Ricardo V | $302,242 | |
| Previous Owner | Sanon Gardy | $79,000 | |
| Previous Owner | Sanon Gardy | $316,000 |
Source: Public Records
Tax History Compared to Growth
Tax History
| Year | Tax Paid | Tax Assessment Tax Assessment Total Assessment is a certain percentage of the fair market value that is determined by local assessors to be the total taxable value of land and additions on the property. | Land | Improvement |
|---|---|---|---|---|
| 2025 | $5,491 | $28,981 | $7,000 | $21,981 |
| 2024 | $5,491 | $27,341 | $6,204 | $21,137 |
| 2023 | $5,181 | $25,795 | $5,732 | $20,063 |
| 2022 | $5,149 | $39,780 | $9,000 | $30,780 |
| 2021 | $5,388 | $33,240 | $9,000 | $24,240 |
| 2020 | $5,112 | $29,700 | $9,000 | $20,700 |
| 2019 | $4,766 | $32,700 | $9,000 | $23,700 |
| 2018 | $4,497 | $21,496 | $7,587 | $13,909 |
| 2017 | $4,382 | $21,496 | $8,268 | $13,228 |
| 2016 | $4,265 | $21,496 | $8,268 | $13,228 |
Source: Public Records
Map
Nearby Homes
- 107-09 221st St
- 108-05 221st St
- 221-36 107th Ave
- 22126 106th Ave
- 22016 108th Ave
- 21919 107th Ave
- 219-19 107th Ave
- 105-03 221st St Unit 3
- 109-15 221st St
- 21867 110th Ave
- 223-23 109th Ave
- 218-17 109th Ave
- 10465 Springfield Blvd
- 104-12 219th St
- 225-09 107th Ave
- 105-01 225th St
- 107-05 Monterey St
- 107-01 Monterey St
- 225-19 109th Ave
- 219-47 112th Ave
- 22120 107th Ave
- 22118 107th Ave
- 22122 107th Ave
- 22114 107th Ave
- 22126 107th Ave
- 22128 107th Ave
- 22112 107th Ave
- 22119 108th Ave
- 221-22 107th Ave
- 22130 107th Ave
- 22117 108th Ave
- 22121 108th Ave
- 221-17 108th Ave
- 22115 108th Ave
- 22125 108th Ave
- 22125 108th Ave
- 22111 108th Ave
- 22127 108th Ave
- 22132 107th Ave
- 22119 107th Ave